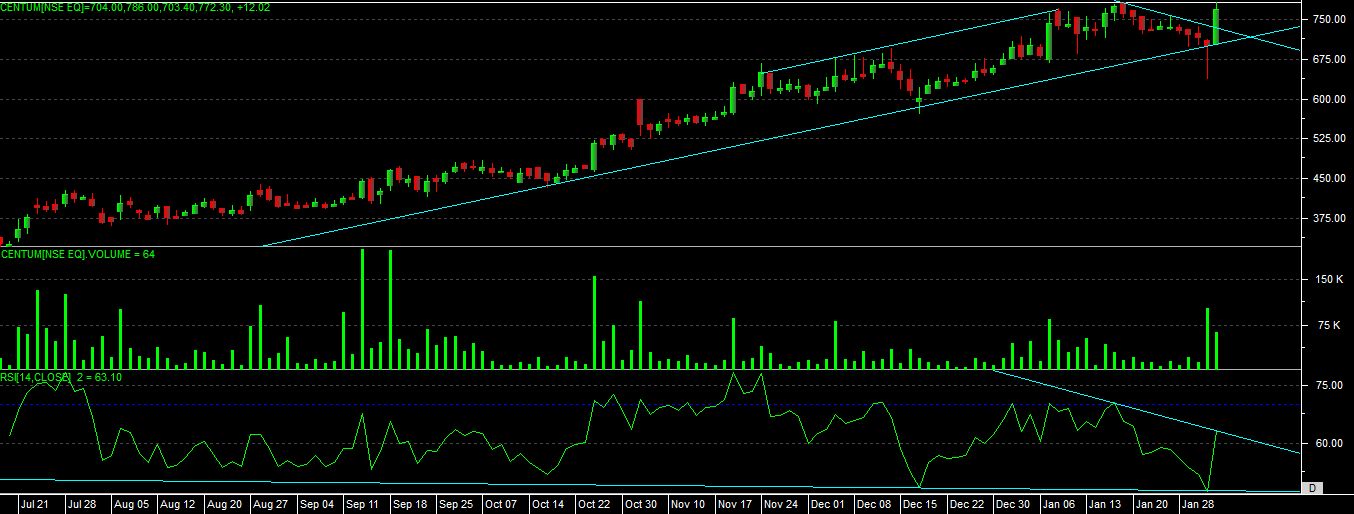
as per the chart development we can see that stock has given “STRONG BULLISH CANDLE” in todays session.
we can even see that stock is moving into ASCENDING CHANNEL, and last session taken support at trendline on closing basis.
at bottom level it has given a “POSITIVE DIVERGENCE” signal and upper level trying to create “BULLISH NEGATIVE DIVERGENCE” signal now.
so overall indication is, if price able to move and sustain above 790 level for 1st 30 min trade then with the support level of 750 it will try to do move till 820-855 also.
if price not able to sustain at upper level and if able to move below 1st 30 min low, then we cant expect a strong breakout move.