Get Top latest market news, Stock Market Views, Stock Market Updates and analysis on stock, derivatives, commodity and IPO markets. Get all Stock market news, BSE, NSE, Sensex Nifty, world markets, Indian markets, stock recommendation, Dalal Street, Day trading, futures, options, SEBI, market news, Business and other Financial News.
Note – stock is in down trend, we are trying to catch its reversal, so pleas note that if it break the downside support level then we can see big fall also.
Before i give detail study about current call, i would like to inform you that on 15th APRIL 2013 we posted positional sell call in UBL @ 760 and recently it made 590 level means almost rs. 160 move (21.5 % almost) now its showing some reverse signal in buy. for reference i am posting the old selling calls link also, have a look.
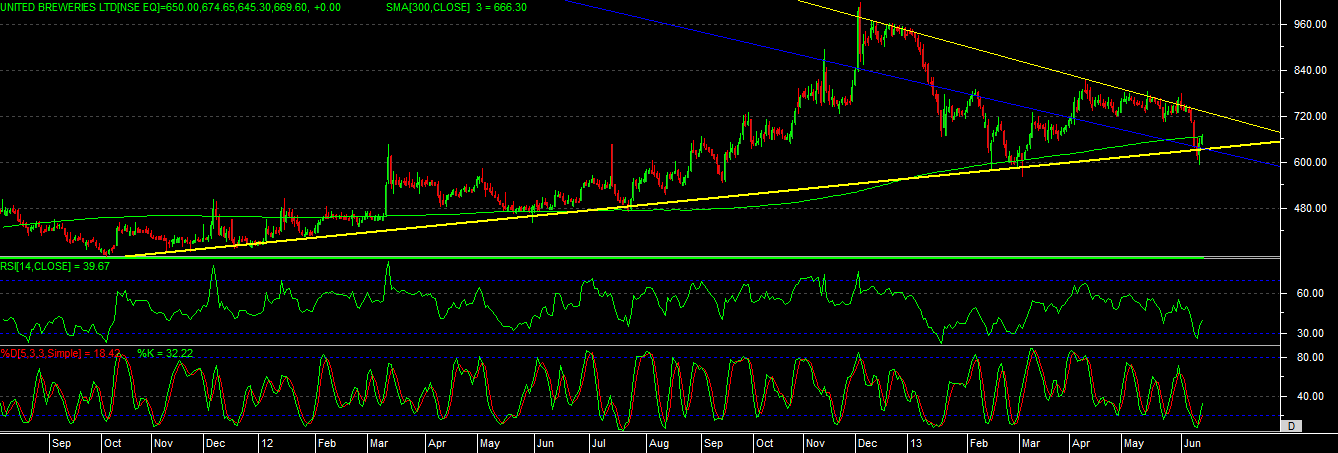
Current positional call study – UBL having 300 SMA support at 666 level and if it able to sustain above this then we can see some recovery in this.
If we observe UBL chart perfectly then we can see that is a creation of Symmetric triangle which is shown by yellow lines, and presently its having good support at downside demand line, which lead to some bounce after confirmation of breakout price.
triangle shows that current low of 590 is very important on chart, if it not able to sustain upside then below 590 we can see some sharp fall in this till 450-350 also, so we suggest if it able to give close above our desire level then will surly try to touch the upper limit in triangle and next move we can decide after that only.
RSI and STOCHASTIC also suggesting that couple of days back its has touched the oversold zone and now coming back from that, so it can also suggest that there is still one up move we can see.
It has also form the rectangle pattern, which can also showing support zone at 590-600 range.
over all study indicate that for time being stock can show some reverse move from here, till its resistance level, and one can also note that, if it break the support level on closing basis, then we can surly expect down move in this till 450-350 levels.