As inform in yesterdays reading if open gap down then 1st 15 min low very important, just see nifty made low of 5617.35 at 9.30-35 bar, and from there it done up move, also told that if sustain 15 min low then we can get reversal signal after 1 hour of consolidation, just see it happen exactly like that only nifty confirm its signal between 10.15-10.30 after 1 hour of trading, we mention the day range of 5610-5775 and see even after a volatile day nifty traded almost in this range only. made low of 5613.90 and high of 5682.
Today NIFTY CHART READING FOR STUDY PURPOSE –
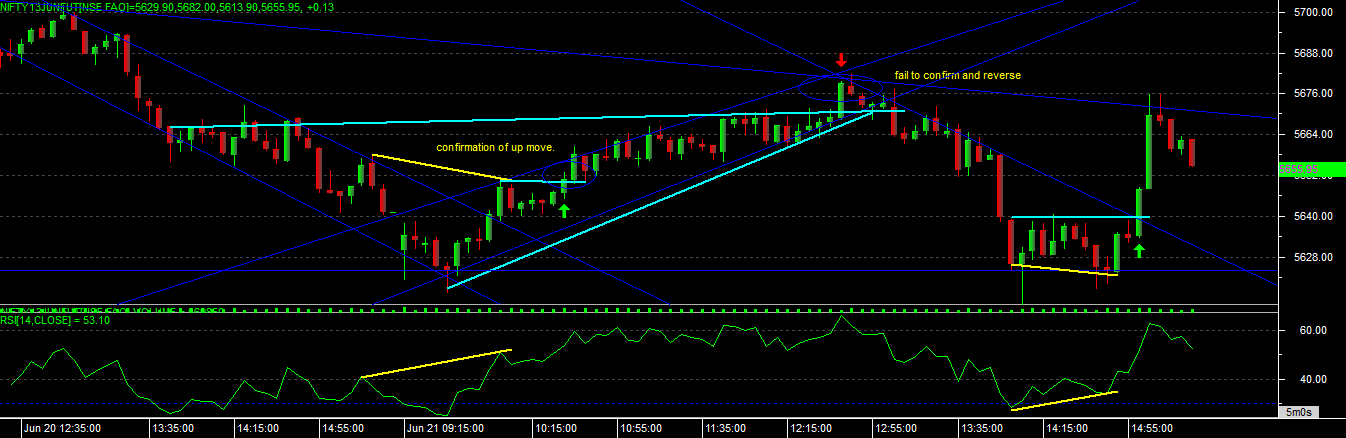
Today stable and positive 1st half and then started the volatility after 1pm till the end, there are many thing i have notice on todays chart, which given the proper signal’s in nifty on every stage.
1. at very 1st we spotted “BULLISH CONVERGENCE” development on chart, and same was confirm by breaking the level of 5651, even it has broken bearish trend-line channel, and enter into bullishness. so here nifty buy was trigger at 5651 level with 5640 as support. (i never able to give this call as not available for the 1st half)
2. After this up move, we spotted Ascending Triangle on a chart, and this was the reason why nifty traded in small range from 11.50 to 12.35 time, after this i was really expecting a big moves and big volatility and it exactly happen like that, it broken the triangle on upside with the high of 5682 but at next point it not able to confirm the up move and started with the red bar on chart, and this given a signal of “REVERSAL OF ASCENDING TRIANGLE PATTERN”, where we sold nifty @ 5675 with 5685 sl and it quickly made till 5613 level (triangle gives high speed moves).
3. After a sharp and panic fall, nifty again get stabilized at 5625-40 range, and in this period RSI generated ” POSITIVE BULLISH CONVERGENCE” signal on chart, and it was confirm at 5640 level, and from there nifty done movement till 5677 in high speed. we avoided this signal due to lack of time and considering high volatility for the day.
overall good day for trading, given steady up move then big volatility with fast movements.
NIFTY VIEW FOR 24-06-2013
IF OPEN GAP UP – If nifty able to open a gap up in next session, then 5680-5700 range will be major resistance range, after opening positive if nifty sustain its low for 15-20 min and able to cross resistance levels then only we can consider some big moves till 5735-5760 levels, if it not able to maintain its gains after gap up then down side support levels will be 5640-5610 below 5600 we can see 5570-5540 levels also.
IF OPEN GAP DOWN – If nifty open gap down and able to break its low in 1st 20 min trading then we can see downside support at 5640-5620 and below 5600 we can see some panic sell off also. If not able to break its low after a gap down for 20 min, then market will needed 1 hour time for consolidation, and after that only some movements are possible, 5680-5700 will me major resistance to consider.
Over all study indicate that nifty trading range to consider would be 5600-5700 levels, and beyond this level we can see some major movements are coming, trading near support and resistance levels can provide with the good output in volatile market, above levels are output of study of historical chart, real time levels and movements can be differ, depending upon the position buildup for the day.