Nifty chart study – in our yesterdays post we already mention that if market open gap up then upside resistance level was 5885-5910 level, and if not break this levels then support between 5850-60 level, and just see how exactly it work for the day, upside nifty not able to cross 5910 level made 5905 high almost, down side it exactly moved into support zone and made 5858 low only.
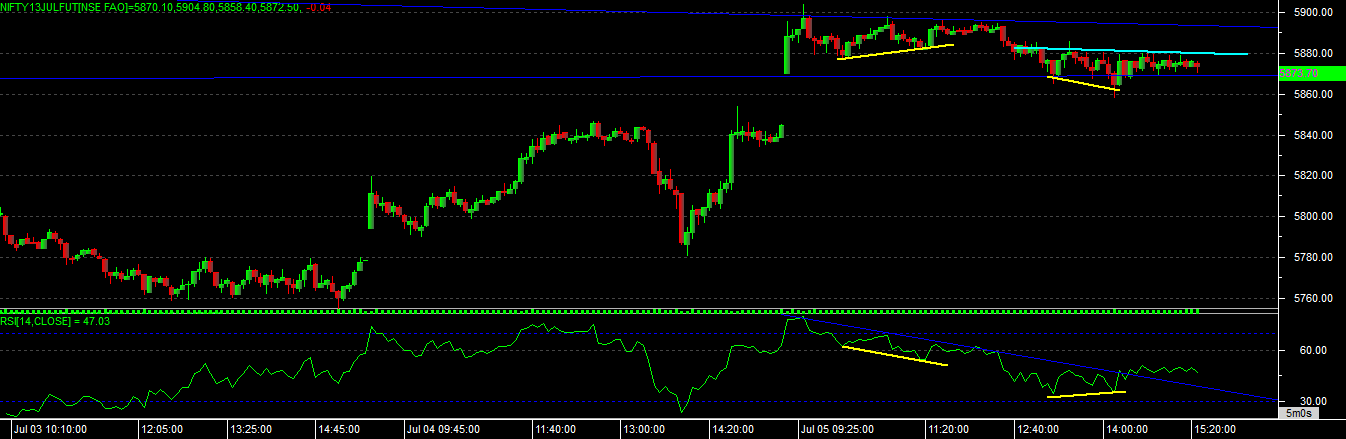
today there was not much movement in index but its worth to study with technical charts, as we inform yesterday if open gap up then it will directly go to the overbought zone, and due to this market not able to move in morning itself after opening upside, after a 2 hours of trading, nifty given positive divergence signal on chart, but it unable to confirm the signal for the same as it fail to cross its recent high on chart and fall down from there, after a lots of confusion with trend, again it given positive convergence signal on chart but again confirmation was not there as it was not cross the resistance line on chart. so market close with small trading range between support and resistance level and unable to produce and intraday trading signal on chart.
VIEW OF NIFTY FOR 8/7/2013
IF OPEN GAP UP – as we can see that RSI is moving flat on chart, of if able to open gap up in next session then immediate resistance levels we can find is 5900-5910 range, after a gap up if market able to sustain for 15-20 min time and able to cross 5910 level then upside we can see 5935-5960 levels. downside support to consider as 5850-5820 levels.
IF OPEN GAP DOWN – if market able to open gap down in next session, then immediate support level we can see is 5840-5850 range, if able to move below this then 5820-5757 levels are downside support levels. after opening gap down for any up move nifty need to sustain for 1-2 hours, and need to sustain the downside support levels in this session, if such thing happen then upside can consider 5890-5910 important level of resistance, above this only we can expect some wild moves.
overall study indicating that, market may try to trade between 5910-5840 levels but if able to cross this levels then we can see some breakout moves in market in either direction.