MARKET TREND – IT’S A FIGHT BETWEEN NIFTY AND BANK NIFTY – DIVERGENCE IN ACT AHEAD OF BIG MOVEMENT – IT’S A PATIENCE GAME FOR SOMETHING BIG
“Still nifty is premature baby, timely expectation can give some big surprises”
If we consider over all movement in nifty and bank nifty last week, nifty able to keep its trend up with flattish movement, but bank nifty given weekly close negative for last week, nifty and bank nifty both are major indices in Indian stock market, but both are trending opposite to each other which indicate that market is still not ready for any big move yet, but such a divergence in major indices indicate that, once the divergence signal is confirm then we can surly see some big movements in a market, but market is the king so we can’t decide the timing for this movements, we need to act accordingly. Following the trend and giving the market time can produce some good results, rather than deciding the trend with timing perception may lead for bad trades in a market.
Last week we inform nifty resistance level at 5930 and support at 5750 level and given a reading range of 5680 to 5900 for week. Just see as per our expectation last week nifty took support at 5750 level and upside able to made till 5905 level near to our resistance level.
NIFTY STUDY FOR THIS WEEK
As we already inform in last week that upside 5930 is important resistance and nifty exactly try to touch this level and reverse.
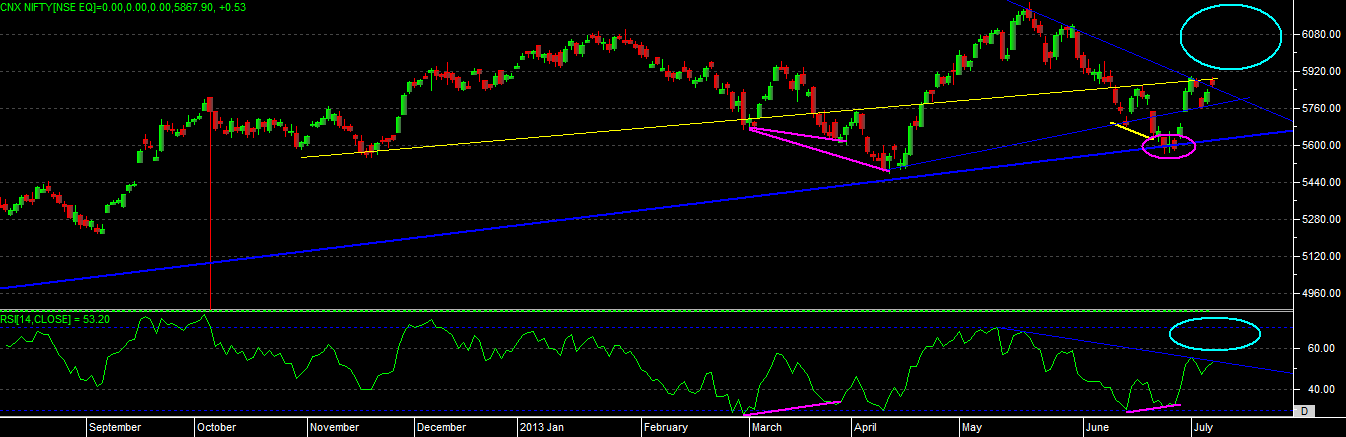
Nifty having 100 days moving average at 5880 level, but after crossing this level nifty unable to close above this level, this shows that there is lack of confidence in traders at upper level. Even last week we seen that nifty given a POSITIVE CONVERGENCE SIGNAL {which we inform 2week back post also} and took a sharp bounce from long term support level of 5550 level.
As we can see in chart that, market is not able to give any positive close above its trend line resistance level, and even its RSI also not able to move above trend line resistance.
As per our study nifty having major resistance level of 5930 level and once it able to close this level for two trading session the we can surly see some up move till 6010-6135-6230 levels, down side we can see support at 5750-5670-5550 levels. As again and again we are telling that 5500 is major long term support for nifty at present so if able to go below this range then we may see reversal in long term trend also.
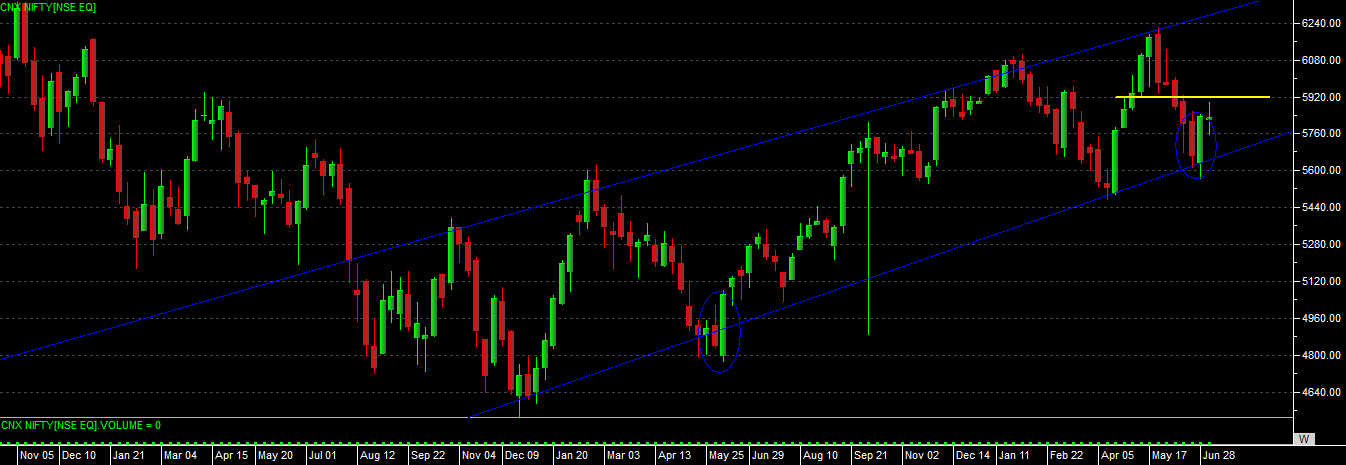
As far as weekly chart concern of nifty its trading between the trend line channel and it has already took support at 5566 level couple week back. As per the candle stick pattern on weekly chart it has created “BULLISH ENGULFING” pattern and able to stay positive after the identification this pattern. As per RSI study nifty not yet moved into overbought zone after coming out from overbought zone, so this can also suggest us that nifty may take chance to do upside breakout also.so overall weekly trend also suggesting that nifty need to move and close above 5930 level can produce some big move up side.
Over all nifty indicating that is having support levels at 5550-5670-5750 and upside we can see resistance at 5930 level.