
DIVERGENCES AT THEIR BEST – STILL NIFTY BANK NIFTY NOT MACHING THE TREND – DON’T GET CONFUSE NOW, WAIT AND WATCH FOR PERFECT TIMING AND BE READY FOR SOMETHING BIG EITHER SIDE IN INDIA STOCK MARKET.
“ “Identifying baby’s gender before born, is illegal” so don’t try to decide the market trend before it confirmed, because time-less decision in market can harm your investment, as well as you also”
From past 2-3 weeks we continually telling you that Indian stock market major indices nifty and bank nifty are on divergence and last we seen this diverging movements in a market, our request for long and medium term investor is please seat aside for a while and just see the game now, save your investment now for future. History tells us that when divergence confirm their signals, market gives a big movements, so let this divergence confirm their signal first and then wait for a proper entry in a market with good capital for multiple retunes {trend can be confirm at either direction}
NIFTY WEEKLY STUDY
Downside support levels are 6000-5900-5850 upside resistance levels at 6075-6150-6230, if nifty able stay above 6075 for 2 days then we can see surly upside move, going below 6000 and if stays below this in 2 trading session then more fall to see in coming days.
Last week clearly mention that nifty has confirm the uptrend on daily and weekly chart and given a first support level at 5900 and just see nifty made 5910.95 low and bounce from there, upside levels we mention till 6150-6230 still it able to made till 6067 level on last day of week.
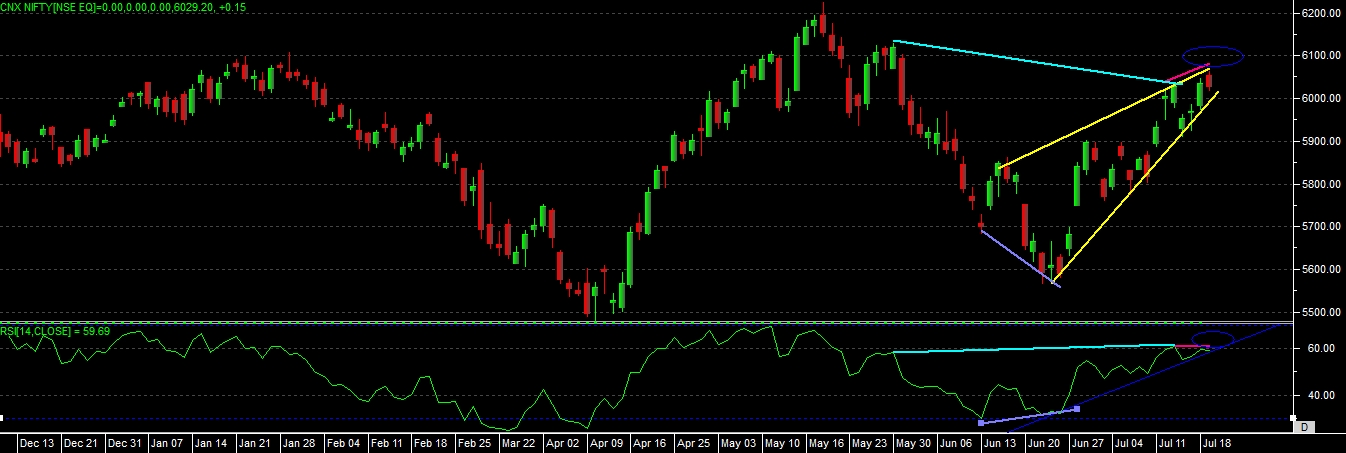
Now as we mention last week also nifty making a RISING WEDGE PATTERN, and this pattern is about to complete now, so more over we can see some movement in this week which can directly affect the long term trend now.
As per the chart we can see that presently it has given POSITIVE BEARISH CONVERGENCE signal on chart, by joining the top at 6134 and 6040 levels, and after that it has given NEGATIVE DIVERGENCE signal on chart, whereas nifty made two top at 6040 and 6067 but RSI fail to make top at that point, RSI made 61.48 and then 60.40 only, even though it’s very small divergence on chart and its still not in a overbought region yet, but as far as market movement consider we should not ignore such small things also.
Candlestick chart also indicate that on Friday, July 19, 2013 it has made BEARISH PIERCING PATTER OR DARK CLOUD COVER PATTERN, which can also indicate that trend has chances to reverse from here.
Over all reading in nifty indicate that, at this point nifty may face some resistance as we can see there are three reversal patterns exits on a chart now, and only hope is nifty yet not moved into overbought zone yet, so one should keep eye on nearest support and resistance levels for better output this week.