Positional call – Buy RELIANCE CAPITAL above 396 {closing basis} sl 330 target 455-510-550
holding period 3-6 month
note – if it able to give close above given levels then only hold delivery in this, if it not able to give close above desire level then we may see some reverse movement also till the support level of 360-330 levels.
technical chart reading –
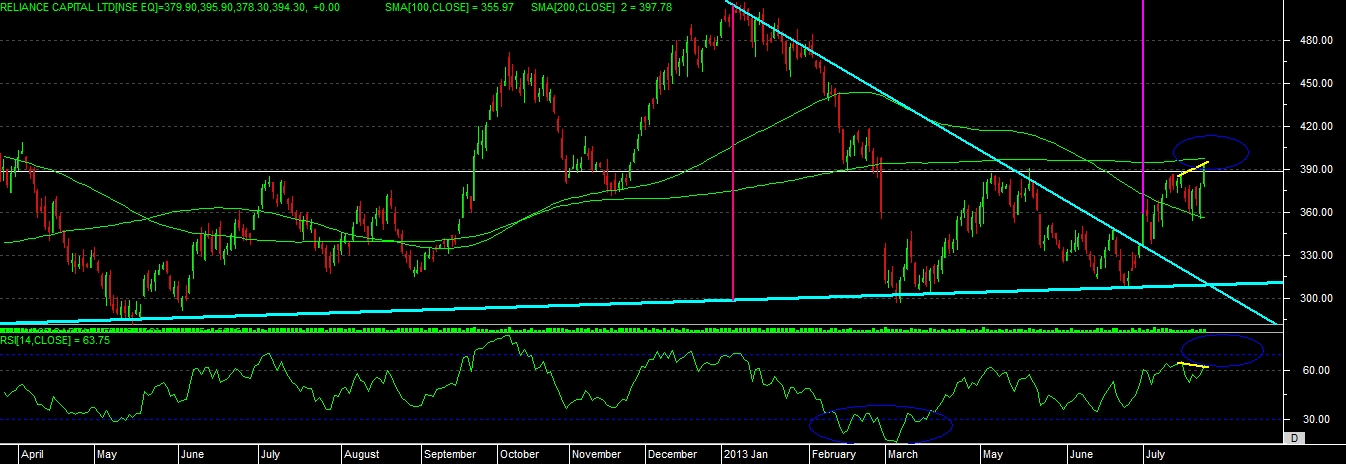
As per the daily chart, we can see that stock is clearly able to move above its 100 days moving average which is at 356 level at present, and its having 200 days moving average in a range of 395-400 levels. so once price able to move above its 200 days moving average then we can see some more strong up move in stock price.
horizontal while line also shows us that stock already has cross the level of 390 and able to close above this on 23rd july 2013, so one more positive close on chart can give some more confirmation of its up coming trend.
We can also see that chart has formed SYMMETRIC TRIANGLE pattern on chart, and it has able to break this triangle at 340 level already, this triangle is having a width of rs. 200 i.e from 300 to 500 so as per this pattern we can see rs. 200 move in stock from 340 level which come around 550 level.
stock is clearly out from oversold zone now, and done consolidation of almost 5 months in a range of 330-390 levels. so moving beyond the consolidation range can give some breakout moves in stocks.
as per the chart we can see that, it has made DIVERGENCE signal on chart, so breaking our level upside and closing above that can confirm the NEGATIVE BULLISH DIVERGENCE on chart. or else possibilities of NEGATIVE DIVERGENCE is also possible so waiting for price confirmation is must in this divergence.
As per the candlestick pattern we can see that it has formed BULLISH PIERCING candle on 22nd july 2013 and also given its confirmation on next trading day.
overall chart study and price movements can indicate us that recently stock has change its trend now, and able to give moment of 15-20% in last 1-2 month period, where as market was trading in a simple range. so we can say that if stock able to move above our desire breakout level the we can see some more action towards its new trend which is in build up right now.