MARKET IS POSITION BASED THAN ANY NEWS – PLAYING WITH LEVELS CAN GIVE PERFECT OUTPUT RATHER THAN WAITING FOR ANY NEWS
“People rather wait for news in any stock or market to build a position, but there are no easy gains in the market, before the news inform buying or selling is done in the market and that we can spot through chart reading, acting after news can give some bad output on your investment, so better to follow with technical level, which will gain support from upcoming news or events in a market.”
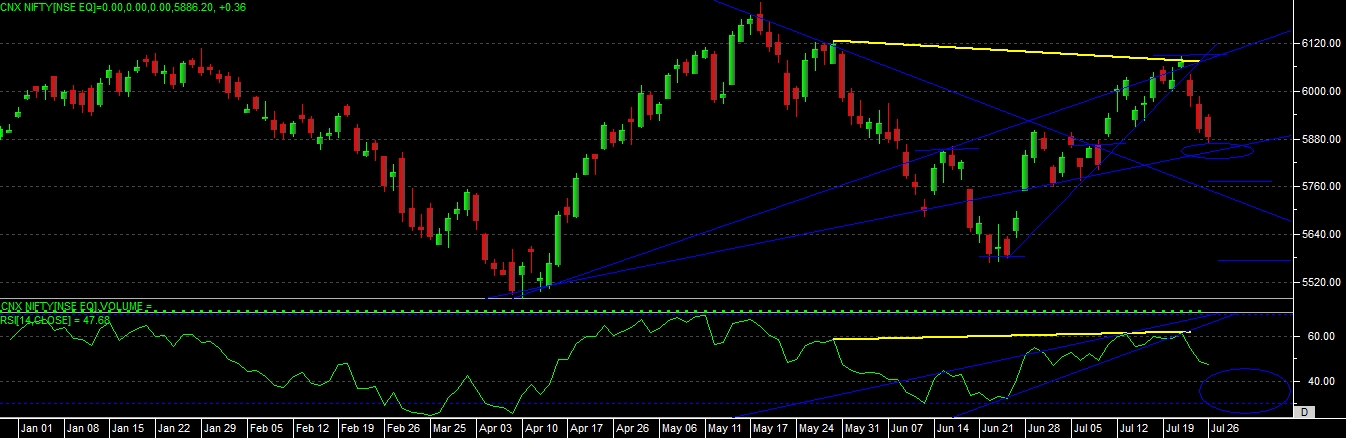
NIFTY WEEKLY STUDY
Nifty last week we inform that if able to close above 6075 for 2 days then only up move to see and it not able to give continuous close above our level and fall till our support level we mention last week at 6000-5900-5850 it able to move till final support till 5850 made almost 5869 on last day.
Overall last week we clearly inform that NIFTY is about to complete its RISING WEDGE PATTERN on chart and also inform that is has created a BEARISH NEGATIVE CONVERGENCE on chart, and you all have seen effect of this in last week both patterns confirm their signal’s and given fall in a market from top levels.
As far as wedge pattern is concern it has given signal at 6030 level last week so we can consider target according to width of wedge, so next support level in a market to see is 5850-5750-5550.
As per the candlestick chart we can see that it has created “BEARISH THREE BACK CROWS” on chart this can indicate us that if next week start with negative then we can see more fall in coming days.
Overall chart study indicating that after giving POSITIVE CONVERGENCE signal and after coming out from oversold zone nifty given a movement from 5566 to 6093 but yet we can see that RSI still not able to move in overbought zone and price started to fall now, and RSI still moving in middle range only, so this can indicate that we can’t avoid reversal in nifty from any mention support, and moving below given support levels and give a fall in nifty.
Overall chart study indicating that nifty having a support at 5850-5750-5550 levels and resistance level at 6000-6130-6250.
Pattern are indicating that we can see fall in next week till any support level downside and major fall can come only after a final support broken. After taking any support if nifty able to give positive close on chart for 2 days then only we can see some reversal in trend and it can try to reach till given resistance levels.