POSITIONAL CALL – buy ITC above 333 sl 310 target 360-410
if break 310 then sell below 310 sl 345 target 275-250
TECHNICAL CHART STUDY –
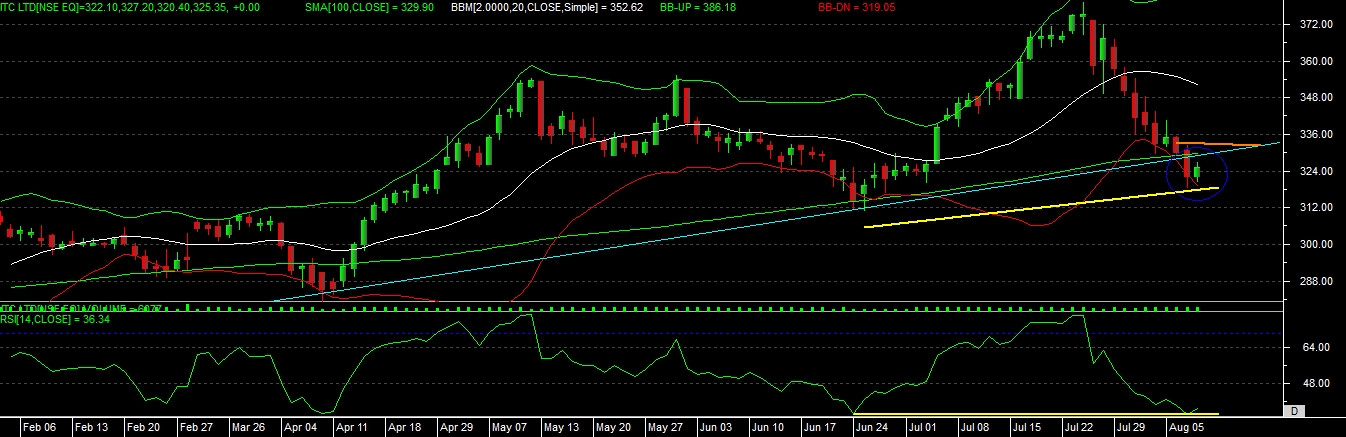
over all technical chart of ITC can tell us that, stock is in long term up trend and recently touched its long term support at 310 level, on chart we can see that majority of times it has taken a support on 100 days moving average and given a sharp bounce from there, and currently also trading near this average level.
in last session it has given a positive bar on chart which is out from oversold zone now in bollinger band but still confirmation is requited.
we can also see that there is a positive divergence on chart so if price able to confim the same then we can see up move in stock.
As per the candle stick pattern it has given a bullish harami candle on last trading day. so if able to confirm this by giving a green candle on next day then we can see reversal in stock.
overall chart study conclude that if stock able to move above desire level then this can be the indication of its reversal and it will again do moves according to its long term trend which is positive till now.