BANK NIFTY TECHNICAL CHART STUDY FOR THE WEEK –
Almost from past 3-4 weeks we already inform that bank nifty is in clear selling from 10800 levels and as per our technical level it has just touched our 3rd support level at 9600 almost.
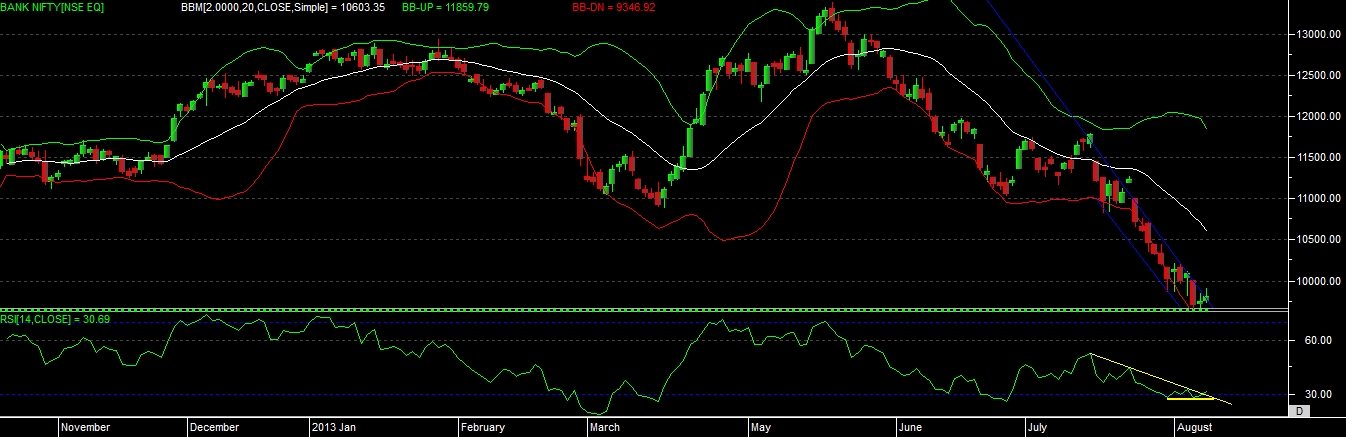
Now look at the chart development in last week, bank nifty given a sharp fall.
At present we can see that price still able to move above the trend line level, and RSI has stopped falling now.
RSI making descending triangle pattern on chart, and also we can spot a POSITIVE CONVERGENCE on chart, as we can see that price chart given a new bottoms but RSI fail to give new bottom that time. It can clearly indicate that, if any time price able to close above resistance level of 10015 then we can see some recovery till next level of 10500-10850
But again we can say that it’s having a decent support at 9600 level and as an RSI also showing some reversal pattern on chart, but same was not confirm by price yet. So once price able to move above 10015 level then it will confirm the reversal.
So overall chart study conclude that we can see action in bank nifty after a breaking a range of 9600 – 10015 only, downside we can see 9000 again a major support. And upside resistance can be seen at 10500-10850 levels.