NIFTY INTRADAY CHART READING FOR STUDY –
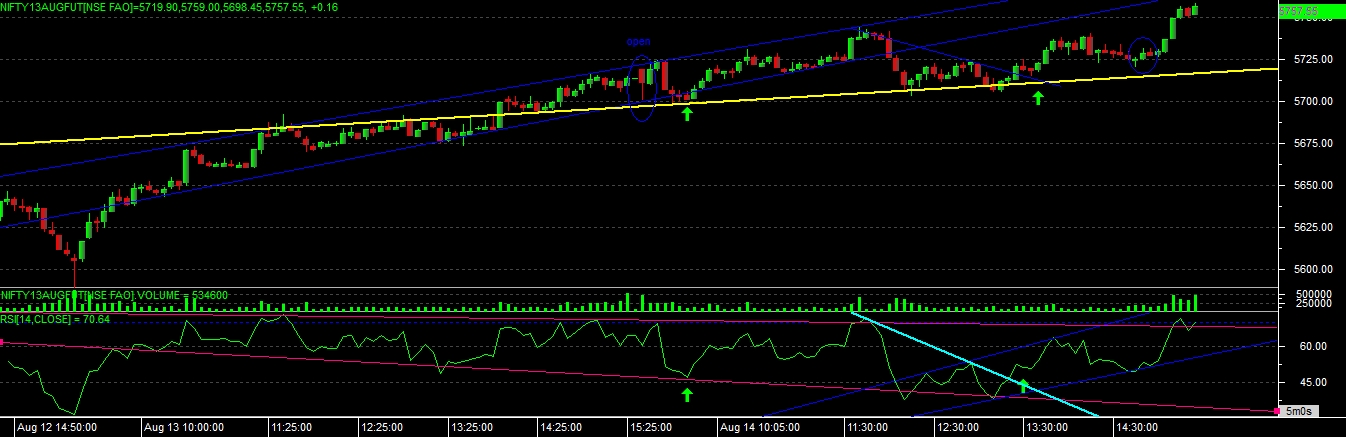
have a look at the chart of the day, perfect up rend, every support used for bounce, and unlimited reult- nifty close near high..
just see todays chart, first observation i can say is PRICE IS RISING but RSI was NOT RISING, and ultimate improvement in RSI drive price higher again.
after almost a flat opening, nifty took support on its trend line and also rsi took support on its descending trend line, as price was not falling but rsi fallen for the day so there was a big scope for RSI to move higher again which drive the price to top and same thing happen on chart, after a first signal nifty made a new top at 5745.50 immediately after the high if we can see, price has faced resistance of supply line, and even rsi touched the oversold zone again, so this indicated a fall or correction it support line, and same happen on chart, nifty again took the support of rising trend line at 5700 almost and bounce from there, same signal was confirm when price and rsi able to break their recent resistance line, and there it given a 2nd buying signal for the day.
at the end we expected a new high as in a circle we shown some candlestick pattern we spotted at end.
1. long leg doji candle which given a confirmation of reversal in trend by giving a green bar in next 5 min.
2. immediately after that we have seen inverted hammer candle on chart, which was confirm the up move after crossing its high level.
so overall all above candle pattern’s and trendlines indicated a up move for the day and nifty move accordingly.
MARKET OUTLOOK FOR 16/8/2013
As we can see nifty given a close at top with RSI moving to overbought zone, so still it can indicate that nifty might go more till 5770-5785 range and from there it can give some correction for the day, which indicate next support level in nifty will be 5715-5690-5670 and if it take bounce form support then upside resistance we need to look for is 5760-5785-5820.
major move in a index can be found beyond the 5670-5820 levels only..till that time it can trade in this range for the day.