Don’t ever make a bias decision over a market trend, market decide its own journey, following trend is always better that deciding the trend, because market is a supreme, and always keep first rule OF technical analysis in mind “MARKET DISCOUNTS EVERYTHING”
Don’t get trap with trend again, trend decider levels are 5450-5850 closing beyond this levels can give a directional move in market.
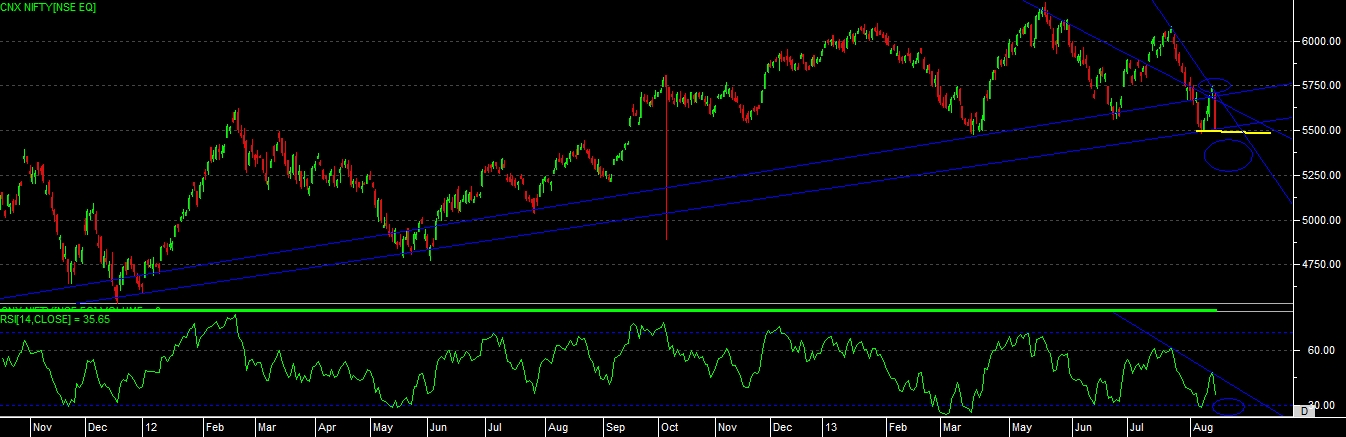
NIFTY WEEKLY STUDY –
Nifty bounced from it long term support level in last week, but all the gains vanished in last trading session, till the level is not broken but we continuity seeing selling pressure at upper side, is it market changing trend now or we can still keep hope for recover?? See what technical levels say about market.
Last week we clearly inform that 5450 it’s a trend decider level, and just see market took bounce from there and fulfill our last target given for week at 5850 and again took a sharp fall in last trading session till the support level.
As per the technical chart pattern, we can clearly see that market is STUCK between two supportive trend lines at present, and if you observe the previous conditions, we can clearly see that, after taking a decent time market able to move out from this range and given a sharp up move couple of time.
And as per the recent chart also we can see that market able to move above the trend line level, but same was not confirm on chart and given a sharp fall till support level on next day. So this time we need to keep a clear watch on this trend line ranges.
About the candlestick pattern, we can observe that it has created “FALLING THREE METHOD” pattern on chart, which is a bearish pattern in nature and it will get confirm once price able to break the low of this pattern which is at 5485 level.
Overall with basic technical’s we can say that, “MARKET HAS DECIDED ITS LEVEL FOR A BIG MOVE NOW, DOWN SIDE 5450 AND UPSIDE 5850 BEYOND THIS, BIG GAME PLAY OF TREND WITH MORE BIGGER OPPORTUNITIES FROM MARKET”
Technical support levels at 5450-5300-5100-4900 and resistance level at 5570-5650-5850.
Last week calls performance {CALLS BLASTING WITH BIG MOVE ACCORDING TO LEVELS EVERY WEEK.}
HDFC BANK sell at 600 to 584 = rs. 16 – 2.5%
IDEA BUY AT 160 TO 177.5 = rs. 17.5 – 11%
MOTHERSUMI 218 TO 242 = rs. 24 – 11%
ITC 333 TO 339.5 = rs. 6.5 – 2%
CADILA SELL AT 690 TO 659 = rs. 31 – 4.5%
SBIN SELL AT 1630 TO 1550 = rs. 80 – 5%
Market big volatile always but our call work according to technical levels.
Current week calls to see.
BHEL closing below 104 can give next levels of 95-75
IBREAL closing below 56 can give levels of 50-45
RELCAPITAL closing below 305 can give levels of 290-270
UCOBANK clsoing below 53 can give 47-43 levels.