Positional call – buy ASIAN PAINTS above 428 closing basis sl 395 target 460-485
holding period 1-2 month
technical chart reading –
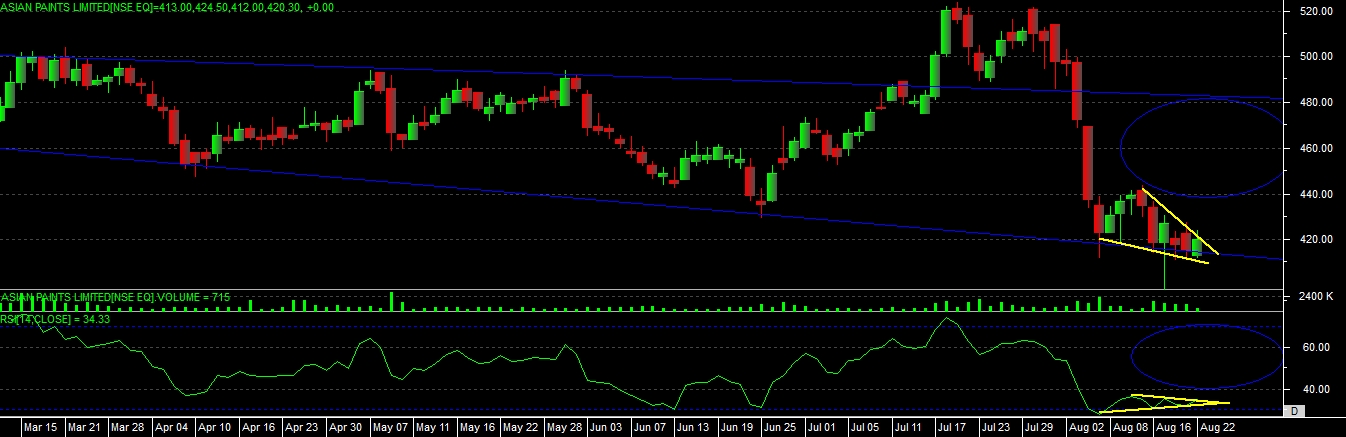
if we look at the chart of asian paints we can see that, it has stop falling now and done consolidation in past two weeks, another thing to notice is, it has made a small falling wedge chart pattern and above given level we can expect breakout.
stock has also taken support on its demanding trendline which is descending.
as per the candlestick pattern we can see that it has made “BULLISH PIERCING PATTERN” which is a sign of reversal in downtrend.
RSI is also come out from oversold zone now, and we can see that it has made a “DIVERGENCE SIGNAL” on chart, so once it able to give close above desire price we can surely say that its a bullish divergence.
so overall basic study come to conclustion that once it able to give close above desire price then we can expect up move in this stock in coming days.