Nifty weekly view –
Can we consider that falling movement is over in market now??
Is it market has fixed its bottom now??
Are this levels are safe now to enter with the investment for long term view???
Have a look at the technical chart study of market, what charts are informing us??
Technical chart reading –
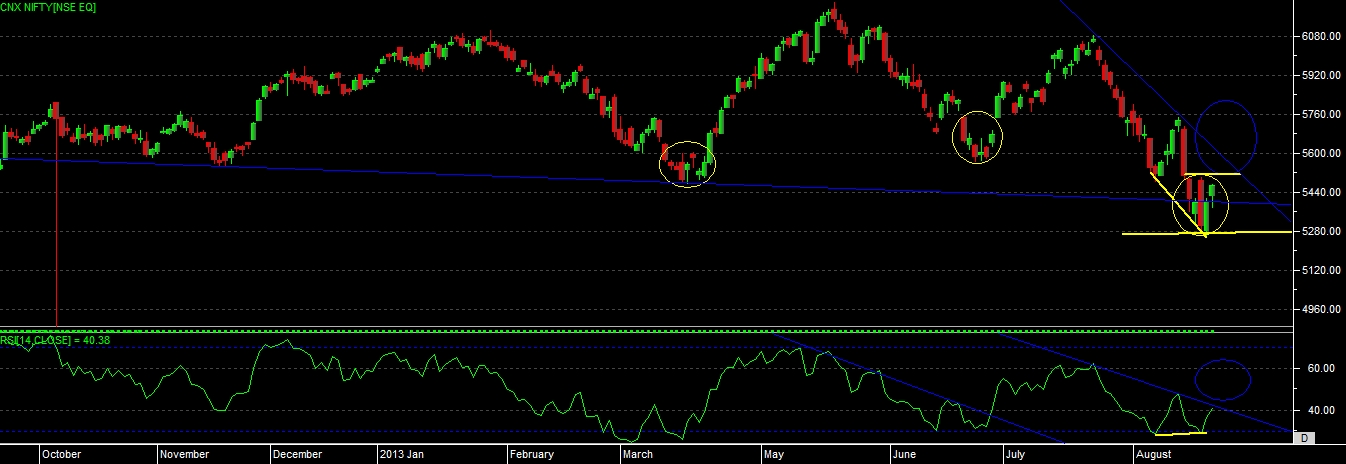
If we look at the nifty chart development we can see that it has given highly volatile moves in last week, 2days of fall and 3days of gains on chart still flat close on weekly chart.
Last week movement indicate us that nifty has form small rounding bottom now, which has form before also around 5480 level and 5600 level and this time its at 5280 level. Look at the rsi it can show us that at every bottom rsi made double bottom, and given a bounce form there, this time also a same development on chart.
Looking at the RSI development we can see that price has fallen with big range in last sessions but RSI has shown down its falling move now, and thus we can see that there is a development of “POSITIVE CONVERGENCE” chart.
Support line which we can see on chart, market still not able to give negative close below this support line for 2 days, which can also indicate that reversal is possible now. {Market given a sharp fall from top level so we need to consider every support at each level because support has the capabilities to change the game}
As per the candlestick pattern we can see that last day nifty has given a “HAMMER” candle on chart, which can also indicate that trend reversal from here is possible.
On weekly chart of nifty we can see that it has given a “HAMMER” candle or we can say, “DRAGONFLY DOJI” candle in last week, which can indicate that if market able to give positive close for current week then we can surly expect trend reversal in coming days.
So overall chart study indicate that nifty is about to stop its falling moves now, if market able to move and close above 5520 level for two trading sessions then we can consider it as a trend reversal, but down side 5250 bottom is fix now for consideration of any down move from here.
Nifty weekly support levels at 5370-5250-5100 and resistance levels at 5520-5650-5750 according to this levels we can expect move in a market.