BANK NIFTY WEEKLY OUTLOOK –
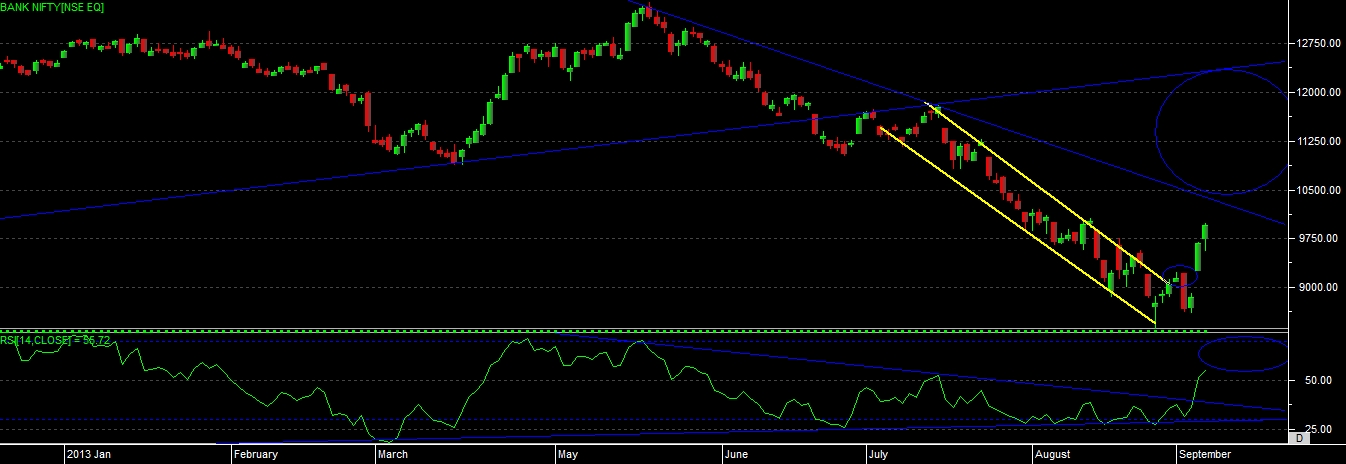
As per the bank nifty chart, we inform last week that once bank nifty able to move above falling trendline channel then we can surly see up move in this, also inform that it has given a POSITIVE CONVERGENCE signal on chart so after moving above this channel bank nifty able to move near 10000 level in last week.
As per the current chart development we can see that, it has given a three rising candle on chart, RSI is also moved above its resistance level now, so in coming days if it able to move above its resistance level then more up move to see in bank nifty.
At present recent resistance level in bank nifty is 10050 if able to give close above this in coming trading session then we can see upside levels till 10850-11250-11650 levels.
Downside support levels to consider at 9550-9250-8900 levels.
Buying after a breakout confirmation or buying near support level can give good trading opportunities in bank nifty in coming week.
Technical calls. –
Buy bharti airtel above 320 sl 275 target 350-395
Buy glenmark pharma at 520-530 sl 490 target 560-700
Sell lupin below 835 sl 880 target 780-740
BUY ITC 300-315 range sl 280 target 350-380
Buy THINKSOFTWARE above 100 sl 80 target 140-180
Buy UBL above 820 sl 750 target 900-1020
Buy HINDALCO above 111 sl 100 target 125-145