AFTER A SHARP RALLY, NOW ITS TIME FOR CONSOLIDATION IN A RANGE OF 5770-5950 , BUT WHAT INDICATION WE CAN GET FROM THIS CONSOLIDATION, IS THIS CONSOLIDATION IS FOR UPCOMING FALL OR FOR NEXT BREAKOUT??? DON’T GET CONFUSE NOW, OR DON’T TAKE ACTION BEFORE ANY MOVEMENT, WORKING WITH GIVEN LEVELS AND LET MARKET TO DECIDE ITS OWN TREND.
As we mention last week about the breakout in our market and it has given a up move from 5700 to 5950 almost.
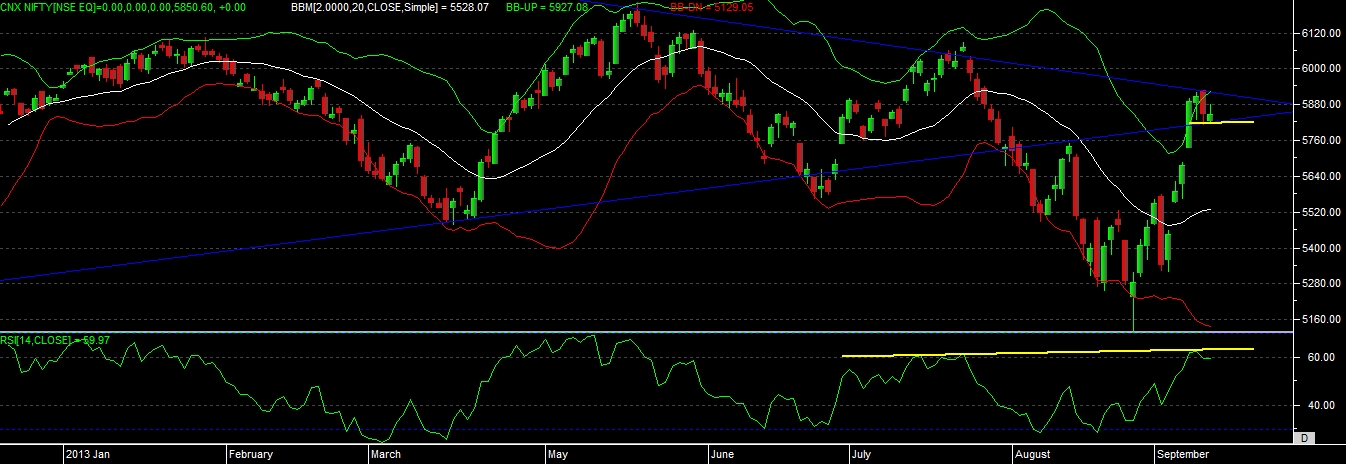
Now what we look in this week, as per the technical chart there are many things to observe in last week. After a bullish candle on first day of week, later on nifty given a “bearish engulfing” candlestick pattern on chart on 11 and 12 sep. this pattern is mostly seen on top levels, when market is about to reverse from top we see such patterns on top.
Even if the reversal pattern is spotted, but we still not confirm the reversal till its not giving the confirmation with technical levels. Overall pattern indicate that the range of pattern is highly important and this pattern has range from 5770-5950 levels. So if nifty able to give close below 5770 level then we can see some selling pressure coming in market, and if able to move above 5950 on closing basis then we can see 2nd breakout on upper side.
Another thing we can notice is at the top market facing some resistance of trend line, {almost in a month of august we inform about SYMMETRIC TRIANGLE – which given fall of 550 points.}
And as per the RSI we can notice that it has given a “NEGATIVE CONVERGENCE” signal on chart, where we see that price fail to cross the recent high but rsi able to move above its previous top level.
As per the Bollinger bands signal it has able to move in oversold zone, but yet not able to start its riding in bands so reversal can took place here also but should confirm with the levels.
So overall technical indication suggest us that, market can either consolidate between 5770-5950 range, bull traders can find buying opportunities nears 5770 and bear traders can execute selling traders nears 5950, but remember one thing once this range is broken then either side we can see some decent moves.
Closing below 5770 can give us down levels of 5650-5550-5350, moving above 5950 and closing above this level will lead for 2nd breakout in nifty which can take market till 6100-6200-6400 levels soon.
So coming week trading between 5770-5950 range is suggested and taking the wild position beyond this range for any further movement.