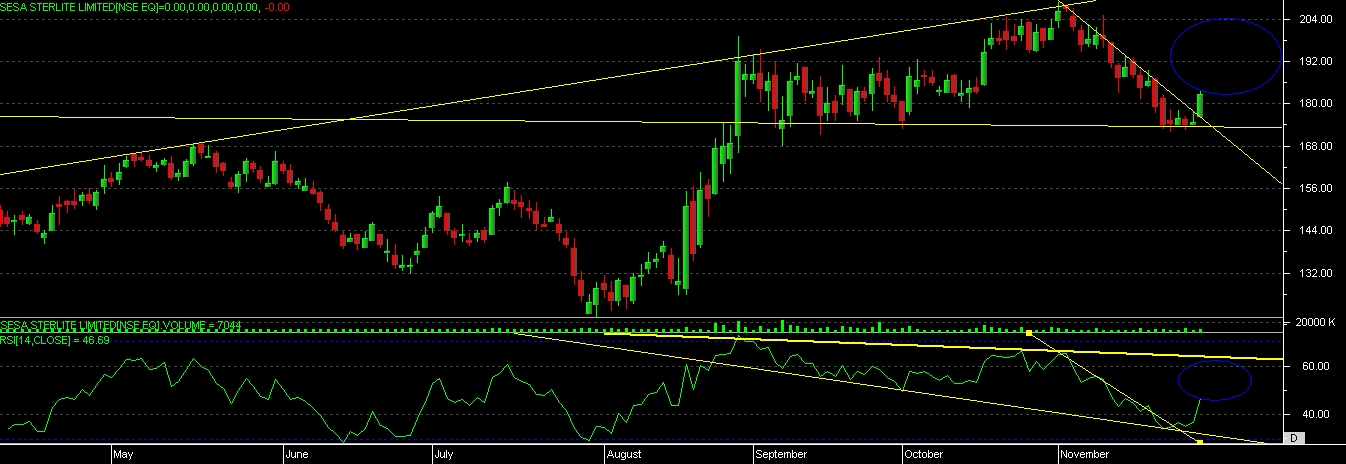
SSLT if able to close above 185 then hold delivery with 165 sl target 205-225
if it goes below 165 then we can see good selling pressure also.
as per the technical chart development, we can see that in past it has taken good support in a range of 165-170 range, again it has form the expanding triangle pattern on chart, which is just able to touch the support level again.
with RSI it has developed “POSITIVE DIVERGENCE” signal on chart and which can be confirm if it able to give close above 185 level for coming trading session.
if price able to confirm the up move then RSI still having more scope to move to the overbought zone so it can give momentum in price.
so follow the level and make use of momentum to keep booking profit on important moves.