MARKET TAKING ITS OWN TIME FOR DEVELOPMENT OF UPCOMING MOVEMENT, PAST 3 WEEKS CONFIRMS THAT MARKET IS TRADING IN ITS RANGE.
TIMLY ENTRY AND TIMPLY EXIT CAN GIVE DECENT GAINS IN TRADING RATHER THAN TAKING POSITION AND WAITING FOR MOVEMENT OR TIME TO COME, SO NEVER EVER TAKE POSITION WITH YOUR PERCEPTION.
LET THE MARKET DECIDE ITS DIRECTION AND TIME FOR MOVEMENT AND WE WILL PLAY ONLY FOLLOWERS ROLE RATHER THAN TREND DECIDER.
“REMEMBER ONE THING RATHER THAN LEVELS OR MOVEMENTS, TIMING IS MOST IMPORTANT PART OF TRADING AS WELL AS MARKET”
Last week we clearly mention that go long in nifty with 5950 sl at current rate as it was given close of 5995 last week, even we mention that bounce is sure with 5950 support in nifty last week, we given target of 6200 and nifty still able to high till 6185 level in last session, which is around 190 points jump from last week close.
Now for current week we can say that upper side 6200-6260 is still important resistance now, in 1st half of the week nifty can try to touch this range upper side, if it able to give 2 successive close above 6250 level then upper side we can still wait for 6350-6400 range, but remember as per long-term charts nifty having major resistance zone at 6400 so no major or big moves before 6400 to expect.
Any negative close near resistance of 6200-6250 range can give fall till down side support levels of 6100-6050-5950 level, big fall can be only seen in a market below 5950 close.
As per the technical chart development we can see that market created some positive bullish patterns on chart and that was the reason for last week up move.
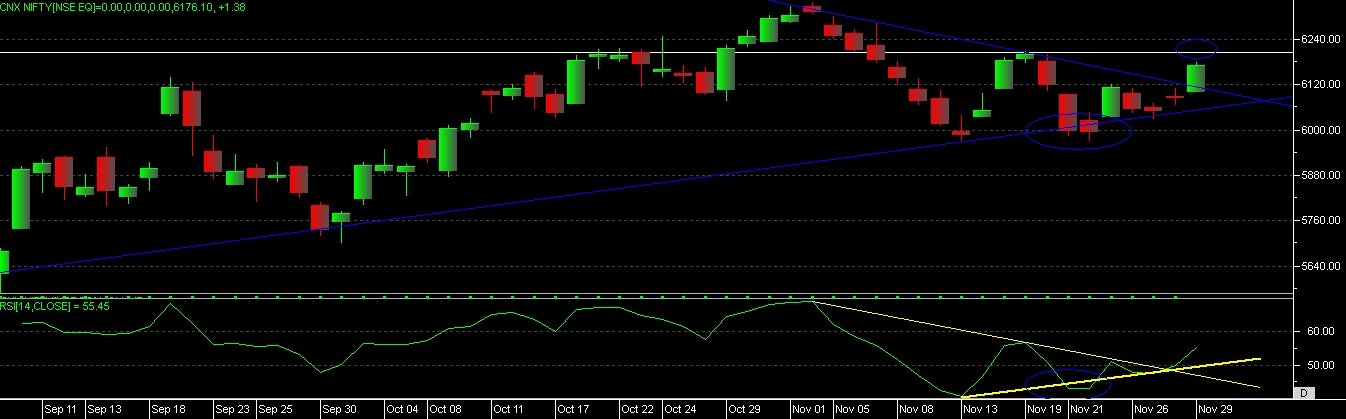
On tend line support market created “EVENING STAR” candle stick pattern or we can say it was “SINGLE ISLAND REVERSAL” pattern on chart, so with this pattern nifty was bullish above 6125 level, when it break this level in last session it able to give move till 6185 level.
Now we can see that nifty has form “SYMMENTIC TRIANGLE” on chart now, and able to give one positive close above trend line resistance so now its waiting for confirmation of triangle breakout with one more positive candle on chart if able to give this candle then more up move to see with triangle breakout, if it gives negative close then we can expect some fall also, so Mondays trading session is highly important for market now.
With the development of RSI we can see that rsi also taken support on chart and able to move beyond the resistance level now, on price chart we can see that market having resistance in a range of 6200-6260 level, so if nifty able to close above this range and rsi also moves up then rsi still having scope to move till overbought zone again, and which can lead market to move more higher level, but remember 6260 is very important resistance now, close above this can only confirm the more up move.
On monthly chart of nifty it has made “BEARISH HARAMI” candlestick pattern, and it’s also a “BEARISH TWIZER TOP” pattern form now, so as per monthly chart market cannot give breakout till it not move above 6350-6400 range, till it below this range, if any resistance face at higher level then fall is sure.
So overall upper side 6200-6260 are important levels for coming week which can decide the further move of nifty, negative close from here can lead for fall and close beyond the levels can even smell for some breakouts.
Again we saying on long term chart 6350-6400 upper level important and down side 5950-5900 down side level important, big breakout of big movement can be consider beyond this range only.