After completing the Christmas and new year holidays, market shown a good volume today, and it was almost 140-150 point fall from the top level in today’s session.
the aggressive selling enter into market after breaking the important support level for the day at 6370 in futures.
here we are presenting two chart studies – NIFTY FUT. 15 MIN CHART AND NIFTY SPOT DAILY CHART for a clear view.
NIFTY FUT. 15 MIN CHART {WHY FALL WAS EXPECTED IN TODAY’S SESSION?????}
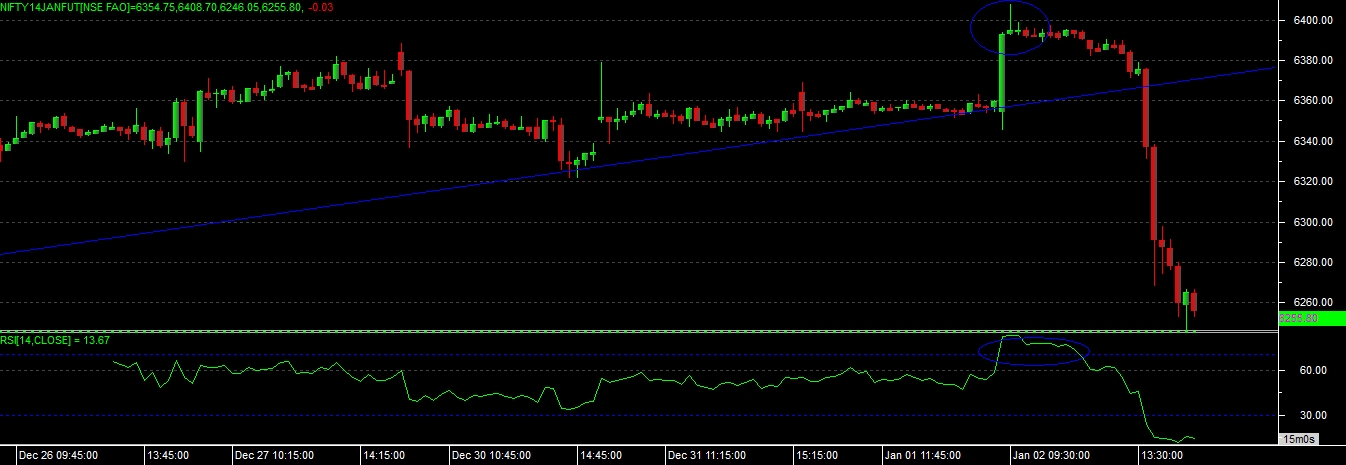
as we can look at the chart we can see that after a some calm session from past 2-3 days today nifty able to open flat and given a sudden spike in 1st 15 min.
is that hinted a buy signal or it was preparation for a big sell off for the day????
just look at the chart, after 1st 15 min, chart has given a “GRAVESTONE DOJI” candle, which is very much famous for reversal, and at the same point market was in very highly overbought zone so it was a clear indication of selling with the stop loss near to the day’s high. and we did the same by selling at 6398.
after this reversal market given a slow and steady fall till, 6370 level which was the support level on 15 min chart, but reversal converted into the proper sell signal after 6370 level and as per the signal market given a good sell off and able to move into the oversold zone with the bottom level of 6246.
NIFTY SPOT DAILY CHART STUDY
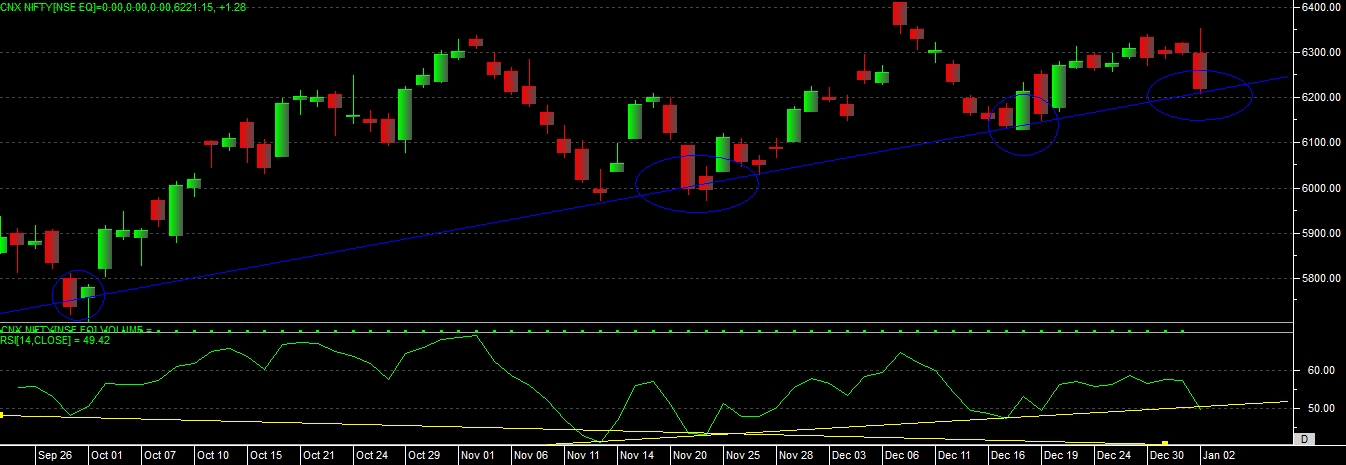
if we look at the daily chart of nifty we can observe one this upside market touch the resistance and down side able to touch the trendline support level today.
current support trend-line represent us that, last 3 time market has given a reversal from this supporting trend line, but out of 3 time, 1st 2 times market able to make new recent high on chart after taking support, but “see the last support development on chart, nifty able to take support, but this time it not able to make a new top on chart and it again came to support level” can we assume this as a weakness in market?????? yes we can surly assume that market is weaker at upper levels now, but yet the fall is not confirm with negative candle below support level, so still its worth for waiting for proper entry at this level.
also look at the RSI development at the present level rsi also taking support on trendline, which is now at neutral zone on chart.
CHART STUDY FOR COMING DAYS
as we seen in above charts that how market started sell off and how it stop at support level.
as we can see the 15 min chart we can see that market is clearly into the oversold zone now, where rsi made 11 level on chart today.
as per the daily chart nifty has close on supporting trend line with the rsi also taking support.
so if market open gap down tomorrow then, then focus will be on day’s low, if the 1st 30-40 min trading low is not broken by market, and able to come above 6275 level, then we can see some reversal move here for intraday.
even if market open gap up, then also today’s low and tomorrows opening low will be consider as a important support level, if both sustain for 30-40 mins and if market move above 6275 level then we can see recovery in a market.
so overall if we looking for reversal in a trend, then market need to sustain the low’s for tomorrows and need to move above 6275 level and trade, we can assume support at 6210-30 range as of now.
for positional view we need to wait till tomorrows close, if tomorrows candle is positive then market can take some support here.
overall, nifty spot is having support at 6100 level on spot chart, below this level we can expect some good selling.