After completing the Christmas and New Year holidays, market showed a good volume, and started New Year with weekly fall of almost 140-150 point from the weekly top level.
Is it a repetition of 2008 or we can still hope for fresh breakout in year 2014????
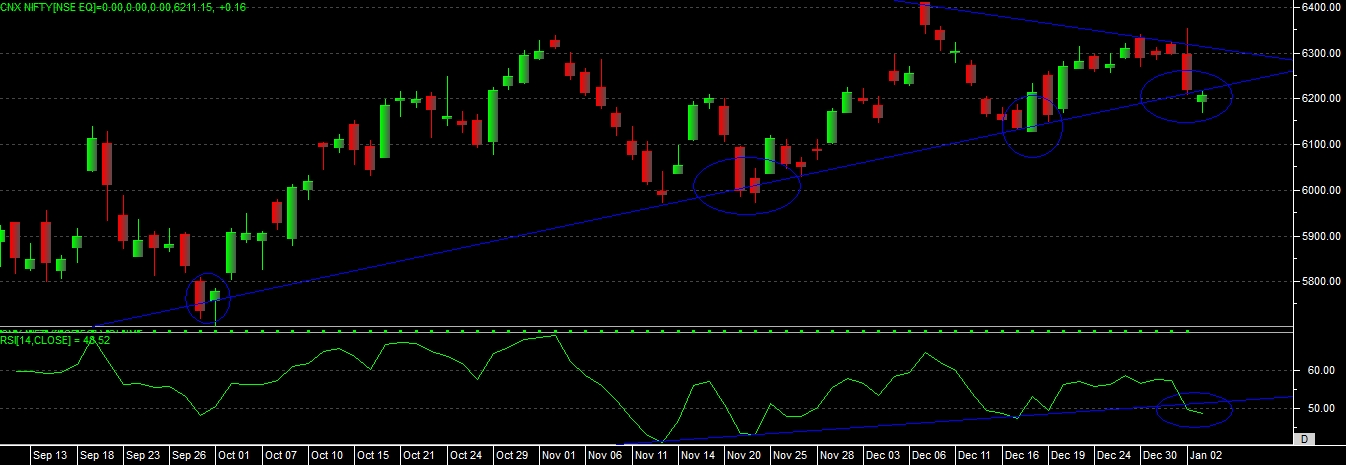
Well market is very close to give some big positional move as per the daily and weekly chart, long term and positional traders can consider important levels of nifty at 6100 down side and 6425 at upper side.
Market will still continue to give you trading opportunities till the 6100 and 6425 range is sustain, once nifty moving beyond this range then positionally we can even expect 1000-1500 points move either side.
We can still wait for monthly close of fresh year, as we mention in our last study that nifty made life time highest yearly close in last year of 2013 so if monthly close goes below yearly closing then we can see some big pressure developing in coming days.
Last week we clearly mention in nifty that if it one gap up on Monday and not break high for 1 hour then take sell position from there with high as a sl, on Monday nifty made opening high at 6344.05 and from there we able to see good fall, and for the whole week market stayed negative excluding last session which made low near 6211.15, as per our strategy nifty able to give 133 points fall from top level in last week.
Now with the current chart development we can see that nifty has taken support on “ASCENDING TRIANGLE’S” bottom level, as it has given a green candle on chart on important support level.
As per the chart we can see that nifty has taken support on given trend line, for last 3-4 bottom’s and from there it able to give a good bounce.
One more interesting thing we can observe about trend line is, when market bounce from the support level, 1st two times nifty able to pass the recent high and 3rd time it not able to move above its recent high level which is near to 6420 level, and again came to support line. This can indicate some weakness at upper levels in market, but that cannot indicate a selling in market.
As per the candlestick pattern nifty has given a “HAMMER” candle on chart on support trend line.
Look at the RSI development, RSI able to move below support level with falling direction, but market able to give green candle at this important point, this can indicate some divergence in direction.
so overall basic study indicate that, market is still having a good support in a range of 6150-6170 and one more positional support at bottom side is 6125 if nifty able to move below these levels then only we can consider positional selling.
As of now considering nifty future, which having a good support at 6185-6200 range one can go long in nifty future above 6275 level with 6185 as sl for upside target till 6350-6450 level. If 6275 not cross for 1st hour of trading on Monday then one can look for selling opportunity near to this level and buying opportunity near to 6200-6185 level, if nifty future close below 6185 then only we can think of going positional sell.