
NEW YEAR MONTH STARTED WITH THE SLOWING DOWN THE TREND?????
DO YOU REMEMBER MARKET IN LAST FEW YEARS???? IF NOT THEN LET ME REMIND YOU.
YEAR 2008 – MARKET MADE NEW HIGH IN JAN – AND JANUARY STATED WITH FALL – GIVEN FALL OF 4000 POINTS – AFTER THAT DONE RECOVERY IN YEAR 2009-2010
YEAR 2011 – MARKET MADE NEW HIGH IN DECEMBER 2010 – AGAIN JANUARY STARTED WITH FALL – GIVEN FALL OF 1800 POINTS – AFTER THAT DONE RECOVERY IN YEAR 2012-2013
YEAR 2014 – MARKET MADE NEW HIGH IN DECEMBER 2013 – AGAIN JANUARY STARTED WITH FALL BUT MONTH IS STILL NOT COMPLETED.
WHAT WE WANT DO IS TO IFNROM YOU ABOUT THE TIME-CYCLE IN STUDY OF LAST 6-7 YEARS IN NIFTY, SEE THE TIME CYCLE, MAKET MAKING HIGH NEAR TO NEW YEAR, THEN GIVING QUICK FALL FOR THAT YEAR, NEXT TWO YEARS IT GOES INTO RECOVERY TILL TOP AGAIN, SO AGAIN IT’S A SAME START FOR THE MARKET THIS YEAR, SO CAN WE EXPECT A SAME MOVES?????? NEED TO WAIT AND WATCH
As we inform last week that if nifty fut. Not able to cross 6275 in 1st hour of trading then take a sell position, and just see nifty fut. Made 6250 almost and able to fall till 6185 till our support level.
With the nifty spot chart we mention that still having support at 6125 and it able to come down till 6140 level.
With the current chart development we can see that nifty able to move below the support level of “SYMMETRIC TRIANGLE” on chart.
In last session nifty given a “LONG LEG” doji candle which can simply indicate that in coming period we can see some big volatility with the big movement candles, and as per the doji candle, if market is able to close beyond the doji’s high and low then only we can take a directional decision.
With the rsi we can see that, rsi also given a weakness on chart, after moving below the support level of triangle.
So with this basic study we can say that at present market has slowed down its upper movement now as it moved out below the support level on chart.
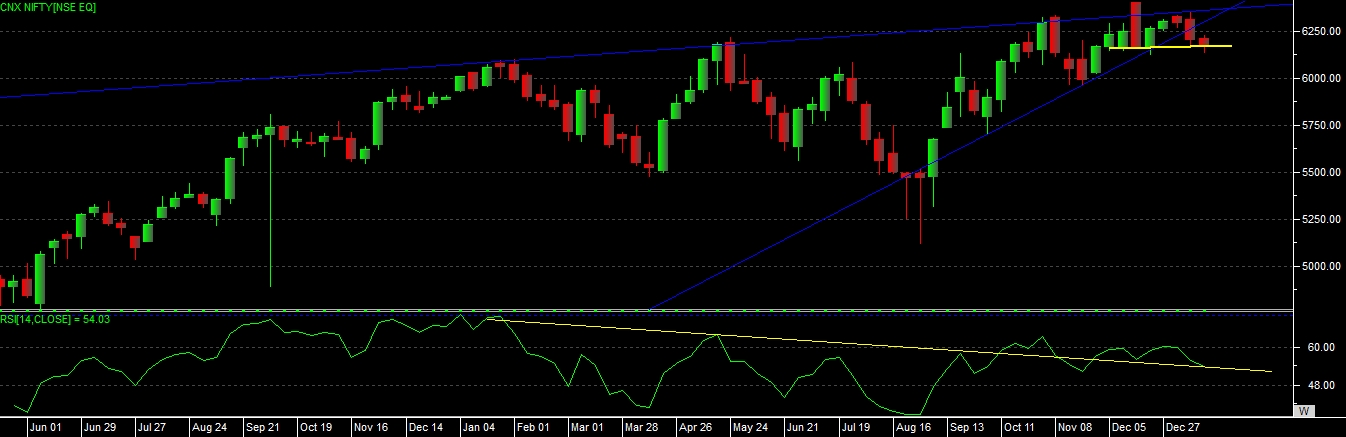
If we study the weekly chart of nifty we can see that, market has made the “RAISING WEDGE” on chart in past 1 year’s period, and able to give weekly close below the support level of wedge, but yet the down movement is not yet confirm, so as per weekly chart we can say that, if nifty able to give one more weekly red candle on below the current low and close, then we can see surly a big fall in coming day, as we see wedge having a width of 1000 points on chart.
Look at the development of rsi on weekly chart, we can see that rsi able to move above the resistance level but price not able to cross its resistance on chart, so it an indication of “DIVERGENCE” on chart and as per this development nifty given a reversal from top level on weekly chart, now it’s time to confirm its trend with the 6100 as a base level on weekly chart.
So nifty basic study conclude that, market still having a support at 6100-6125 range, so with this range as support we can even expect some bounce in market, but if nifty able to give close below 6100 level, then only we can think for positional selling.
If any how market able to get support at 6100 then one can make buy position near to 6100 with 6100 as stop loss on closing basis and wait for upper levels till 6250-6350 but if nifty give close below 6100 then exit from long side, and after closing below 6100 if next day nifty breaks previous day’s low then take positional selling position below that level, down side support to consider at 6000-5800-5500.