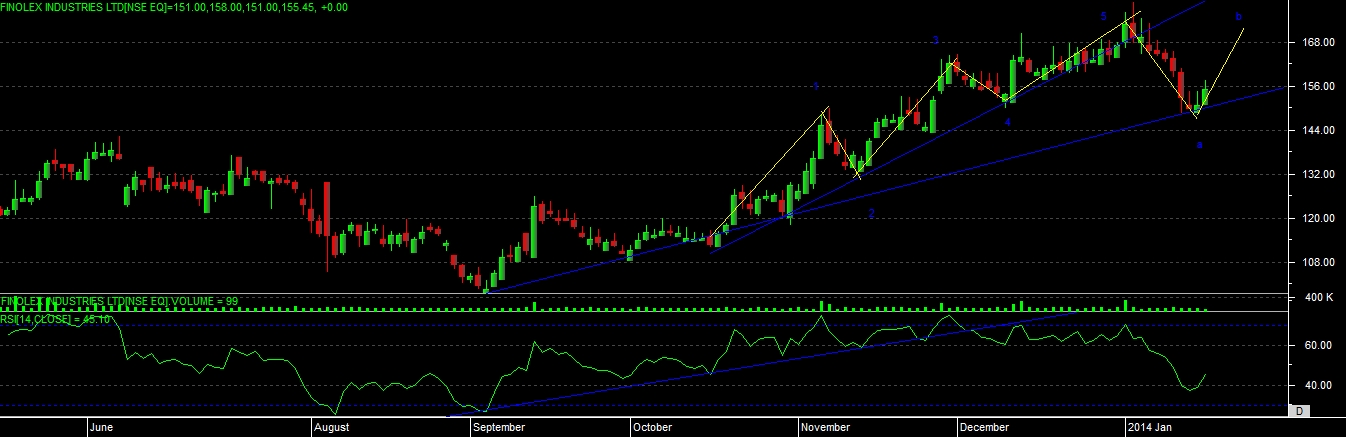
Look at the chart of finpipe, we can see that stock is in good up move and its almost triple in last 1 year.
with the trend line we can see that stock has broken the support at upper level, but with the 2nd trend line it has taken a support now, so if price able to sustain here then we can some just in stock.
as per the candlestick patterns we can even see that it has created a “INVERTED HAMMER” pattern on important support level and today it has able to move above the hammer top and able to give close above the level.
as per the ELLIOT WAVE THEORY we can see that stock has able to made its 1,2,3,4,5 and wave A on chart now, and with the recent bottom it can try to form wave B, which can lead for the move, below the recent top level.
look at the rsi development, with the trend-line we can see that rsi has given a much more weakness in recent past, but yet price able to stay on support with two recent green candles..
the basic technical development suggest that, one can buy in this stock above 158 level one can also try to collect a small qty near to support of 149 and keep sl at 145 on closing basis target we can see is 165-175. only if close above 158 then only hold delivery with given levels.