MOST IMPORTANT THING IN MARKET IS RISK MANAGEMENT – IF YOU ABLE TO MANAGE RISK OF YOUR MONEY THEN DON’T WORRY ABOUT RETURNS.
WHEN YOU TAKE POSITION, BEFORE ASSUMING THE PROFIT, TRY TO CALCULATE EXPECTED LOSS IF STOP LOSS HIT – DECIDE YOUR LOSS AND THEN TAKE POSITION AS PER THE STOP LOSS WITH CALCULATED QUANTITY, BECAUSE MANY TIMES TRADERS DON’T THINK ABOUT STOP LOSS OR THEY NEVER THINK ABOUT HOW MUCH QTY TO BUY, AND THIS TWO THING LEAD FOR A BIG LOSSES IN A MARKET.
NORMALLY WE THINK THAT IN A STOCK MARKET WHEN ONE PERSON EARN OTHER PERSON LOSE – BUT ITS NOT THAT WAY IT’S A GAME OF FLOATING QUANTITY.
YOU INVEST IN A STOCK AND IF YOU GIVEN TIME TO YOUR INVESTMENT THEN AS PER COMPANY’S GROWTH COMPANY PAY’S YOU WITH THEIR GROWTH AND PROFIT.
“SO MARKET IS PURE INVESTMENT, AND INVESTING IN GROWING COMPANY THAT’S WHAT MATTER”
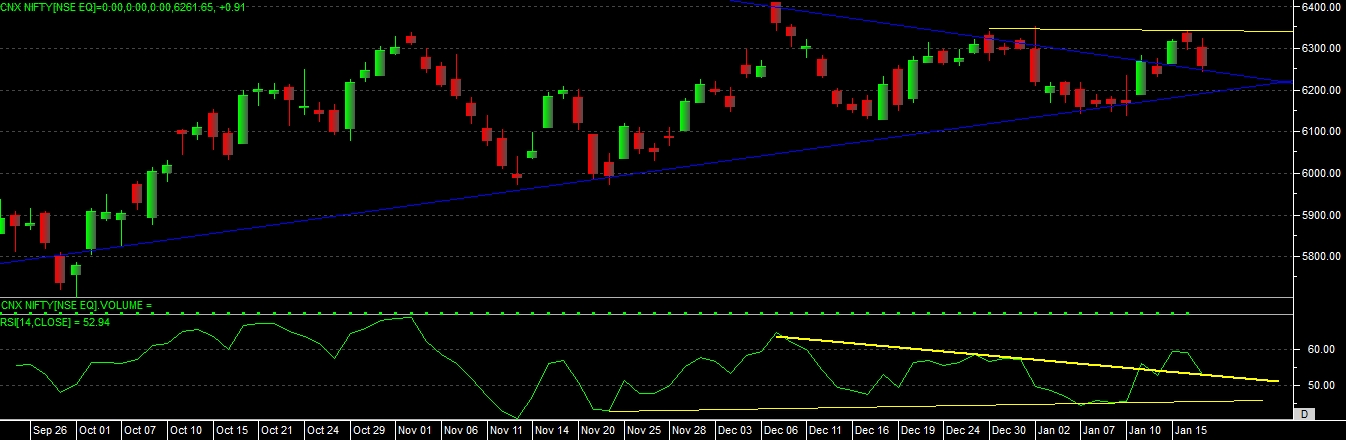
In our last week study we clearly mention that market having a strong support near to 6100 level and by keeping this support in mind one can buy in nifty for 6250-6350 level, and just see market able to give up movement exactly till 6350 level, last week almost given a move of 157 points as per our levels.
Now with consideration of current week chart development we can see some patterns are buildup in last week.
Previous week, last two sessions we saw that market has given a noticeable fall, as it faces the trend line resistance upper level at 6350, as shown in the chart.
Also there was a development of “HANGING MAN” candle on last Thursday, and on Friday there was a development of “EVENING STAR” candlestick pattern on chart.
Pattern suggested bearishness in a market, but wait there are more thing to observe on chart at present level.
If we notice closely we can see that there is a “SYMMETRIC TRIANGLE” pattern on chart and nifty able to move above this level, but after facing resistance upside it able to touch the support line of triangle now.
As per the rsi we can see that rsi able to cross the resistance on chart, but the price action unable to give direction to the rsi, and rsi again came down at support level.
Last session nifty able to touch the 20 days moving average as per the daily chart, which indicate some support at this level.
As per the weekly chart of nifty we can see that it has made “INVERTED HAMMER” pattern on weekly chart.
From past 7 weeks nifty not able to break the level of 6125 on chart, and from near to this level market has given 3-4 time sharp bounce.
So as per the basic study concern we can see good support in a market at 6125 level as of now, till the time market not moving below this level one can buy on support and try to sell near the resistance of 6250-6350 range.
Nifty future is having a support at 6235 level, if able to move below this level then we can see support at 6175-6200 range, so one can try to buy in nifty at this support levels, once this supports are broken then only look for selling in nifty, if this supports are taken then upside we can see 6310-6350 and moving above 6350 and closing beyond this can give 6435-6500 levels also.
But remember if market moves below 6175 level on closing basis then we can see some good selling till 6100-6000 levels in coming days.
“So overall nifty spot having important level of 6125 on closing basis and nifty future having important level of 6175 on closing basis, till the time market is above this levels we can still expect strongness in a market, but if nifty close below this levels then we can expect a positional selling also”
So one can trade in nifty future near to support and resistance levels with very small stop loss so it can avoid a risk of losses.