buy DHANUKA above 219-220 range sl 178 target 270-315-370 {hold only if close above 219-20 range for the day}
holding period 3-6 month
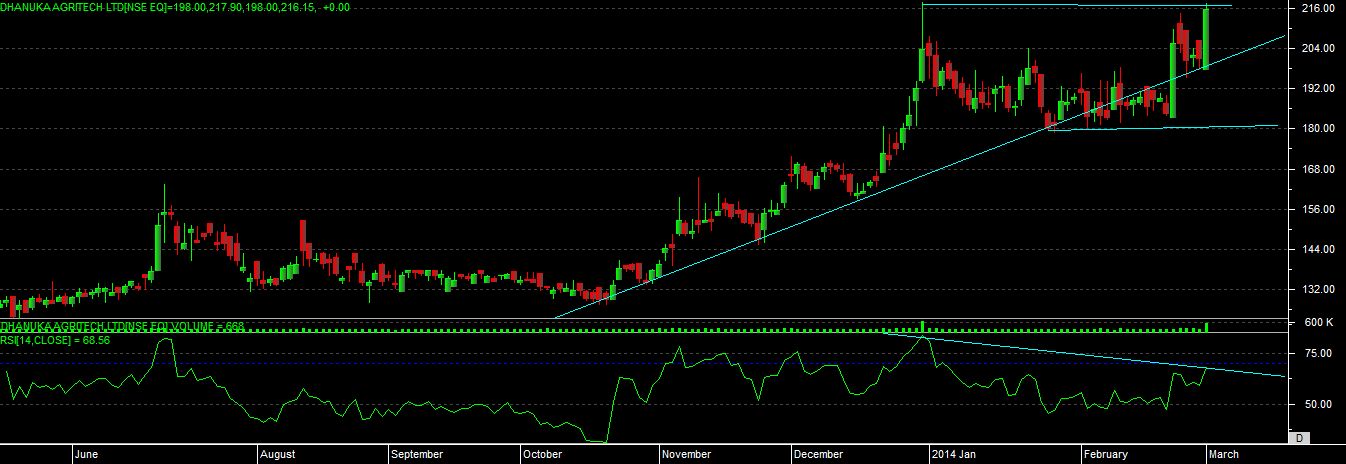
technical chart study
we can see that price has taken support on trendline.
with rsi its making “NEGATIVE DIVERGENCE” signal, so it price able to move above recent high the we can see good positional breakout in chart.
as rsi still having a scope for a upper move now.
as per the candlestick pattern price has given a “RISING THREE” candlestick pattern on chart now.
so over all consideration is if price able close above recent high level then we can hold this stock for delivery with recent low as a support.