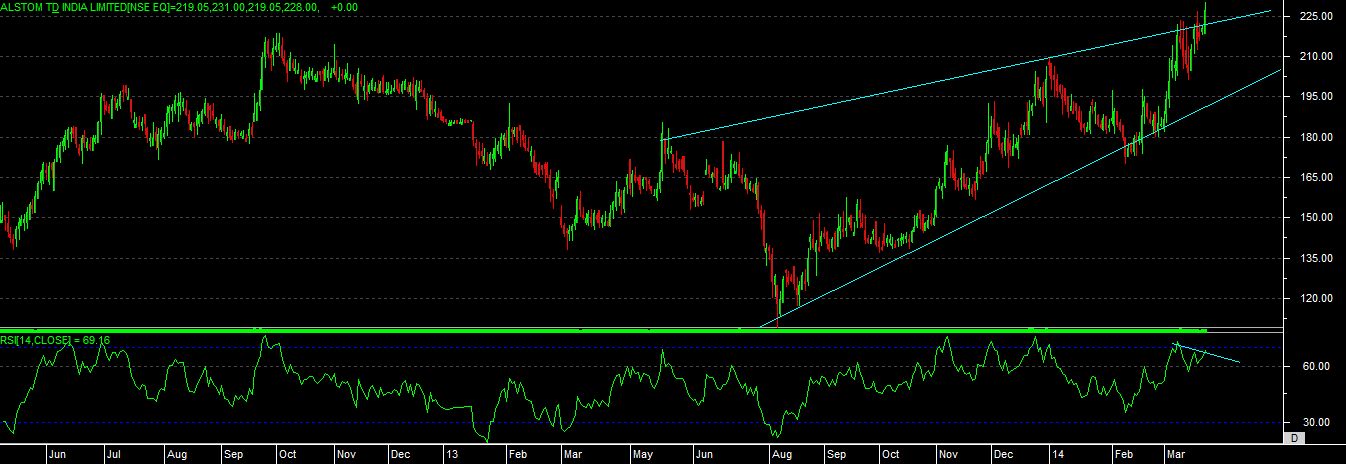
buy ALSTOM T&D above 231 or one can buy small in a range of 222-230 also , sl 195 on closing basis target 285-325-365
holding period 3-6 months
technical study
right now we can see that stock is moving in rising wedge pattern, but able to move above upper resistance level in last session.
with the rsi presently its making “BULLISH NEGATIVE DIVERGENCE” pattern and one more green candle can confirm this verywell on chart.
so overall one can buy this stock in a mention range also can add above inform level if close, and hold with mention level for upcoming movement.