NIFTY WEEKLY CHART STUDY
In our last week study we mention that market is not showing a weakness signal yet and after a breakout of 6450 we mention target of 6800 in our previous articles and this time it able to made till 6780 range.
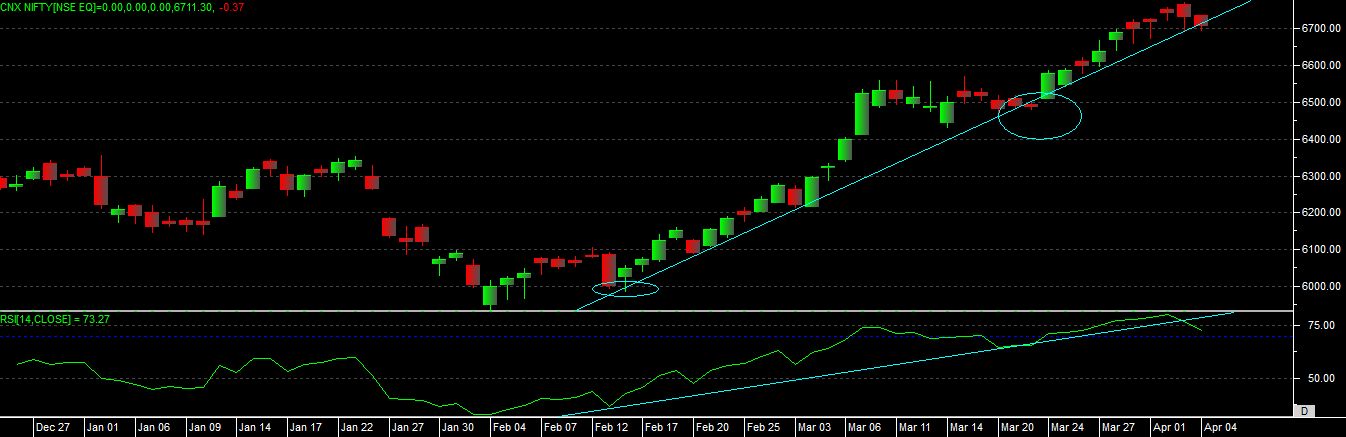
As per the recent pattern development and technical chart we can see that market still taking support on trendline.
Nifty spot has given a three “HANGING MAN” candles in a row after that it has given a “LONG BLACK CANDLE WITH LOWER SHADOW” just two session back, and in last session it has given a “BEARISH BELT-HOLD” candlestick pattern on chart, but this time price we can see that making leg below trendline.
If we look at the rsi we can see that after moving into overbought zone, it able to move below support line but price yet not given a close below support level so this is kind of “DIVERGENCE” at this stage.
Overall this study can indicate that with such bearish patterns form at upper level in market can indicate that there is a good short position build up in a market, but yet market unable to find a proper direction.
So if nifty able to move below 6660-6675 range on closing basis then only further fall to see in a market, otherwise this levels can even work as a support levels which can even produce a reversal in a market.
So overall next week if nifty close below 6650 level then only go for fresh short position in market for target of 6500-6400 range which is near about 1/3 correction as per current levels calculations.
If market able to take support here and give green close on support line, then we can see possibilities of “POSITIVE DIVERGENCE” so if such thing happen then only look for buy with 6550 support which can take market to even fresh high again.
So ultimate thing is 6650 is key level now closing below this in red can give fall and closing above this level in green can again produce a bottom reversal.