buy CCLPROD in a range of 50-55 sl 35 on closing basis, target 85-110-150
holding period 3-6 months
technical study
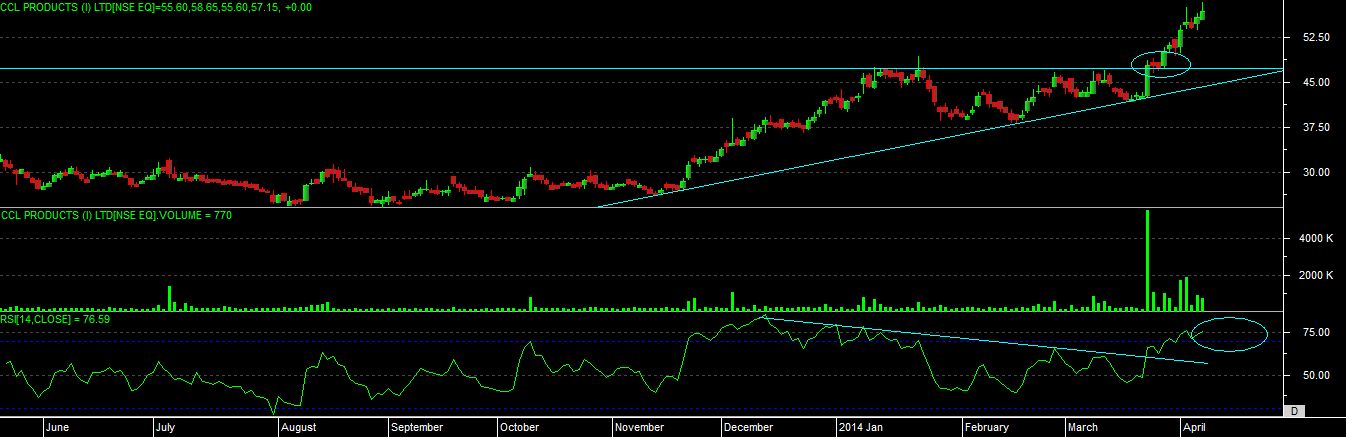
as per the chart we can see that recently stock has given a breakout by closing above 50 level, and right now stock is trading on its life time high level.
so its a indication that we can see a good move in this stock in medium to long run.
as per the recent chart, it able to break the “ASCENDING TRIANGLE” chart pattern, and at same point it given a “BULLISH NEGATIVE DIVERGENCE” breakout also at same point i.e. around 50.
just now rsi has moved into overbought zone, so stock can try to slow down its pace or can move slowly also.
even the breakout is supported by a good volume.
so one can buy this stock at current level and also in a range of 50-55 if come, and remember one-thing till the stock is above 35 level we can see a good move or a big move in this one.
so calculate your risk with 35 sl add qty as per your limit only, and keep booking and adding as per momentum for a good trading and good investment also.