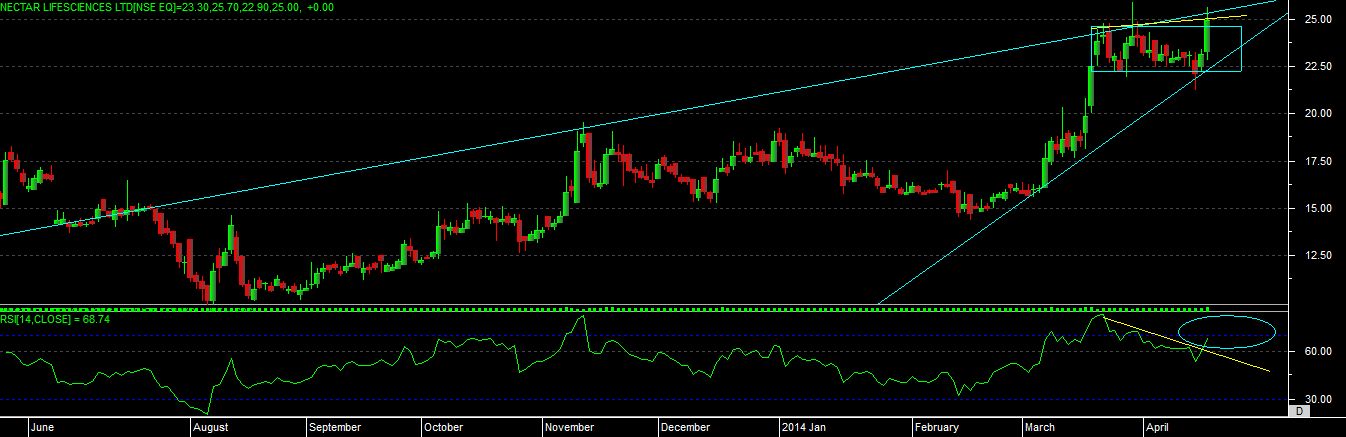
buy NECLIFE above 26 close sl 20 target 32-38-45
technical chart study
as per chart pattern we can see that stock has form “RISING WEDGE” on chart now, and able to hit upper level today, with almost double top level,
there is also a development of “FLAG POLE” chart pattern and today it able to move above the flag range, so braking and closing above recent top level can suspect a good up move in stock.
as per the rsi it has given “BULLISH NEGATIVE DIVERGENCE” on chart now, so as per pattern if price able to move above recent high then it can give some bullish signal’s as rsi is still having a good scope for moving into overbought zone.
so as per study if price able to move above mention level on closing basis then hold this stock with mention levels for good move.