buy ALSTOM INDIA above 482 close sl 375 target 575-625-750
3-6 month holding period
technical chart study
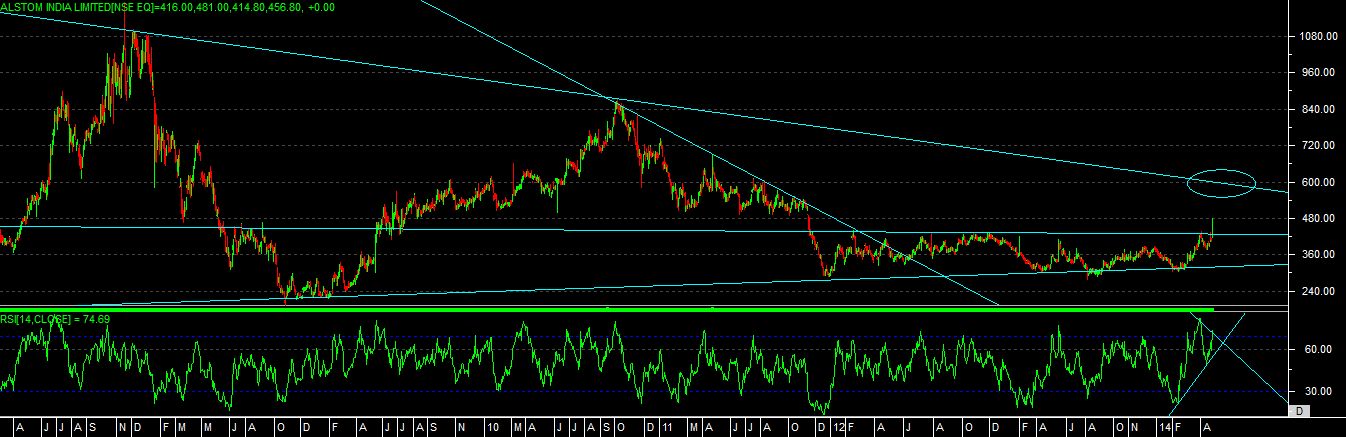
as per chart development we can see that price able to move above its 3 years high level in last trading session.
after a 2010 fall, it has done consolidation from 2011 to 2014 {till date} in a range of rs. 200 price band.
as per the candlestick it has given a “BIG BULLISH” candle with the abnormal volume spotted in last session.
with the rsi it has given a “BULLISH NEGATIVE DIVERGENCE” signal at top level,
so overall view is if price able to move above inform level and able to give good close above mention level then we can expect a good move in coming days in this stock.