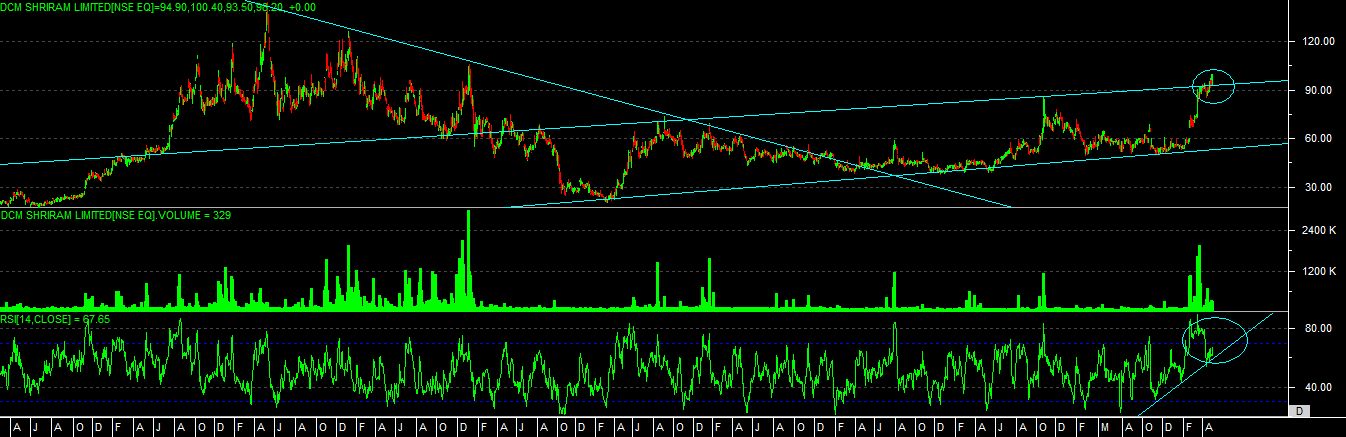
buy DCMSHRIRAM above 101 closing basis, sl 80 target 145-185-225
holding period 3-6 months
technical chart study
as per technical chart reading we can see that stock is now trading at 5 years high level now, and in last 5 years it has done consolidation in rising channel in a range of 40-90 level.
even it able to move above its long term resistance trendline.
now look at the development of rsi, it has taken support on every low made by stock, and now its given a “BULLISH NEGATIVE DIVERGENCE” signal at top level.
so as per all the above development we can see that stock has able to cross the important range, so once it able to move above our mention level then we can see good move in this.