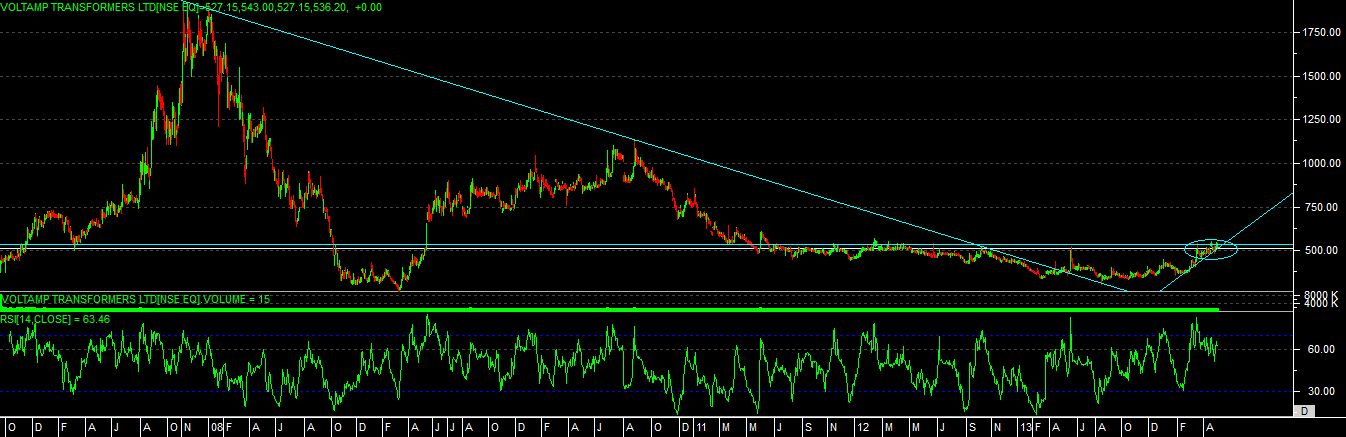
buy VOLTAMP above 555 closing basis, sl 450 target 850-950-1115
technical chart study
as per the long term chart view we can see that stock is about to change its long term trend on chart, as it able to move above the long term resistance level and making a higher high’s now.
its has done consolidation for near about 2 years on chart, so once it able to move above given price on closing basis then we can expect a good move in stock.
one weekly time frame its has given a big “POSITIVE DIVERGENCE” signal at bottom level, so closing above the level can give some spark in this stock.
recently it making a “BULLISH NEGATIVE DIVERGENCE” on chart now, which can even indicate some support in this stock, but breakout we can expect only if close is good.
so overall stock changing its trend so we can get entry at proper level and then need to wait with support level for coming days move.