buy J&K BANK above 1900 close risk lover can even add between 1800-1900 range sl 1600 on closing basis target 2500-3200
holding period 6 months to 18 months
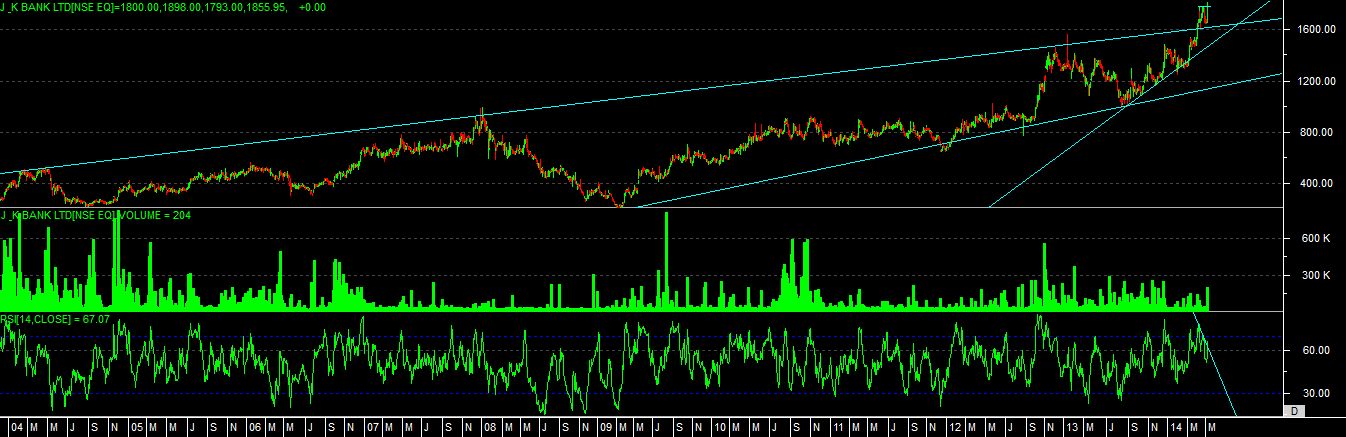
technical chart study
as we can see that stock has given a good move in past decade, and even this decade it started with good up move, so we can assume that till the time stock is making higher high’s on chart it will keep performing.
recently at 1600 level it able to break then “RISING CHANNEL” or we can say “RISING WEDGE” on chart. which can indicate that now stock has started its 2nd run for long term.
even rsi showing a “BULLISH SIGNAL’S” on chart now, with pending scope for movement, so if price able to move above mention level then we can see some big moves in this stock in coming days.