buy RATNAMANI above 275 closing basis, sl 225 target 350-450
intrday can also buy above 275 hold if sustain for 15 min sl 250-55 range target 297-325
technical chart study
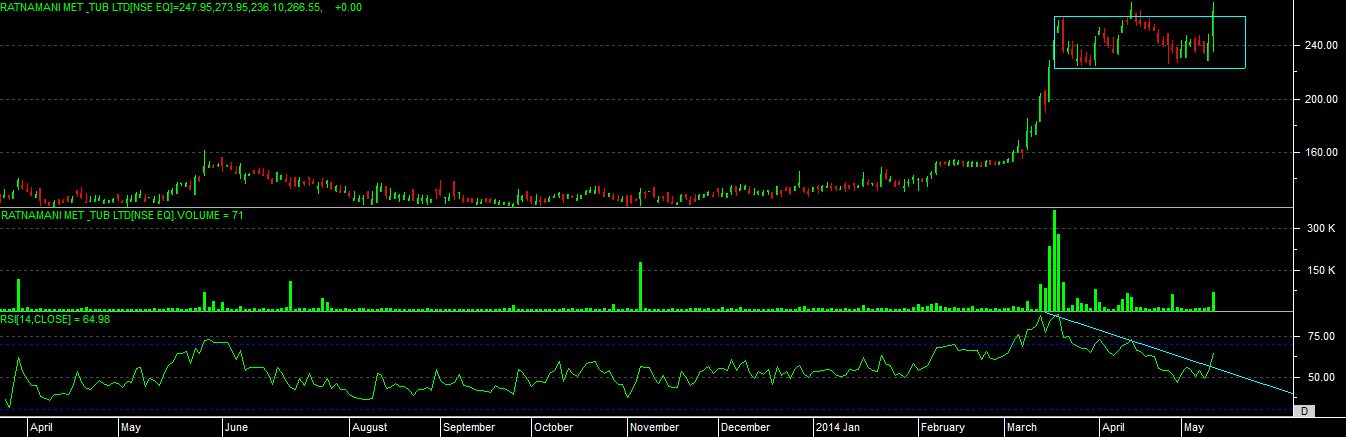
as we can see that stock is trading near to its life time high level and recently it move above its 5 years high level, which can indicate some bullishness in this stock.
after a fast move in recent past it has done consolidation for almost 2-3 months time period, so if able to break levels and move further then will try to move in new price range.
today stock has given a “STRONG BULLISH” candle on chart, and also made a double top with todays high level, so moving above mention level can bring some momentum in this stock.
even rsi showing some bullishness now, which is still having a scope to move in overbought zone now, normally a “BULLISH NEGATIVE DIVERGENCE”
so overall aspect from the stock is if price able to move above mention level and if able to produce good close for the day, then we can see good momentum in price.