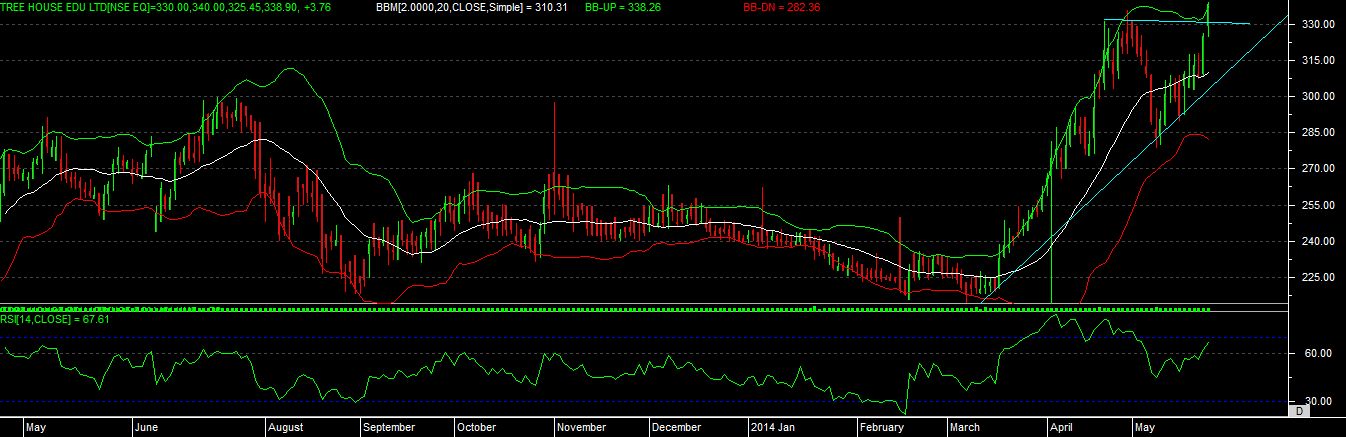
buy TREEHOUSE above 340 close sl 310 target 380-420
technical chart study
as per the chart development we can see that stock is trading at life time high level and recent high it made before 15 days has been also broken in last session.
last two session stock has given a “STRONG BULLISH” candles on chart.
last two month we seen it has done the “BOLLINGER BANDS RIDING” and after that done 15 days consolidation, recently in todays session it again touch the bollinger band, so if it able to move above the recent high on closing basis then again we can see the price riding the upper band.
price has taken support on trend line and able to make a new recent high, and rsi is still resting near to overbought zone, so any price action can give trigger to rsi, which can possible bring some good move in stock.
so overall stock is trading at good level now, so if the mention level is sustain on closing basis then only can hold this stock for good gains.