buy KEC ENT above 130 close sl 110 target 170-220-260
for small risk takers one can buy near to 110 level also, cmp is 116-118 range, and keep sl at 100 after triggering level of 130 one can move sl to 110 but only for risk lover because this buying is near support so it can go or may not go for breakout.
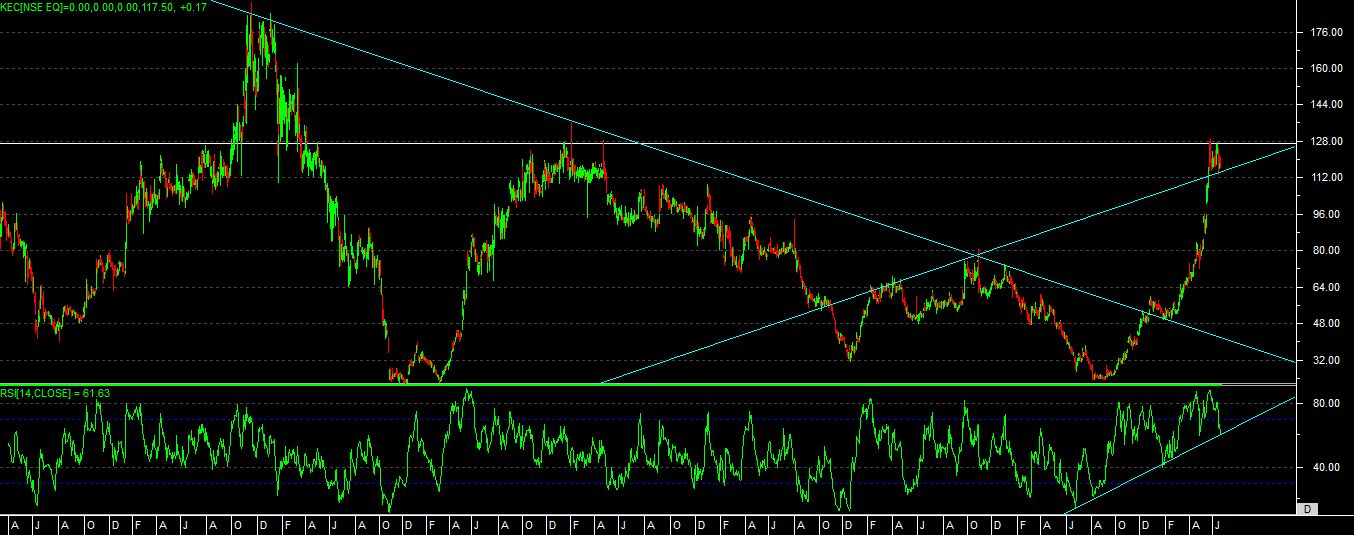
technical chart study
as per the chart we can see that price able to hit the 4-5 years high level on chart recently.
stock has already given a divergence signal at bottom level and able to move above resistance level in past, so this can indelicate us that stock is very well in up move.
as of now we can see that rsi is on support level.
price might take support on trend line, but moving above resistance on closing basis can provide us breakout in stock, which can be a breakout of “DOUBLE TOP” also.
even rsi can given us “BULLISH NEGATIVE DIVERGENCE” breakout at that point.
so overall basis assumption is, if price able to move above mention level on closing basis and also able to take support near to 100 to 110 level then we can see good breakout in this stock in coming days, which can provide us with best investing opportunities keeping involved risk in mind.