2 hours technical chart
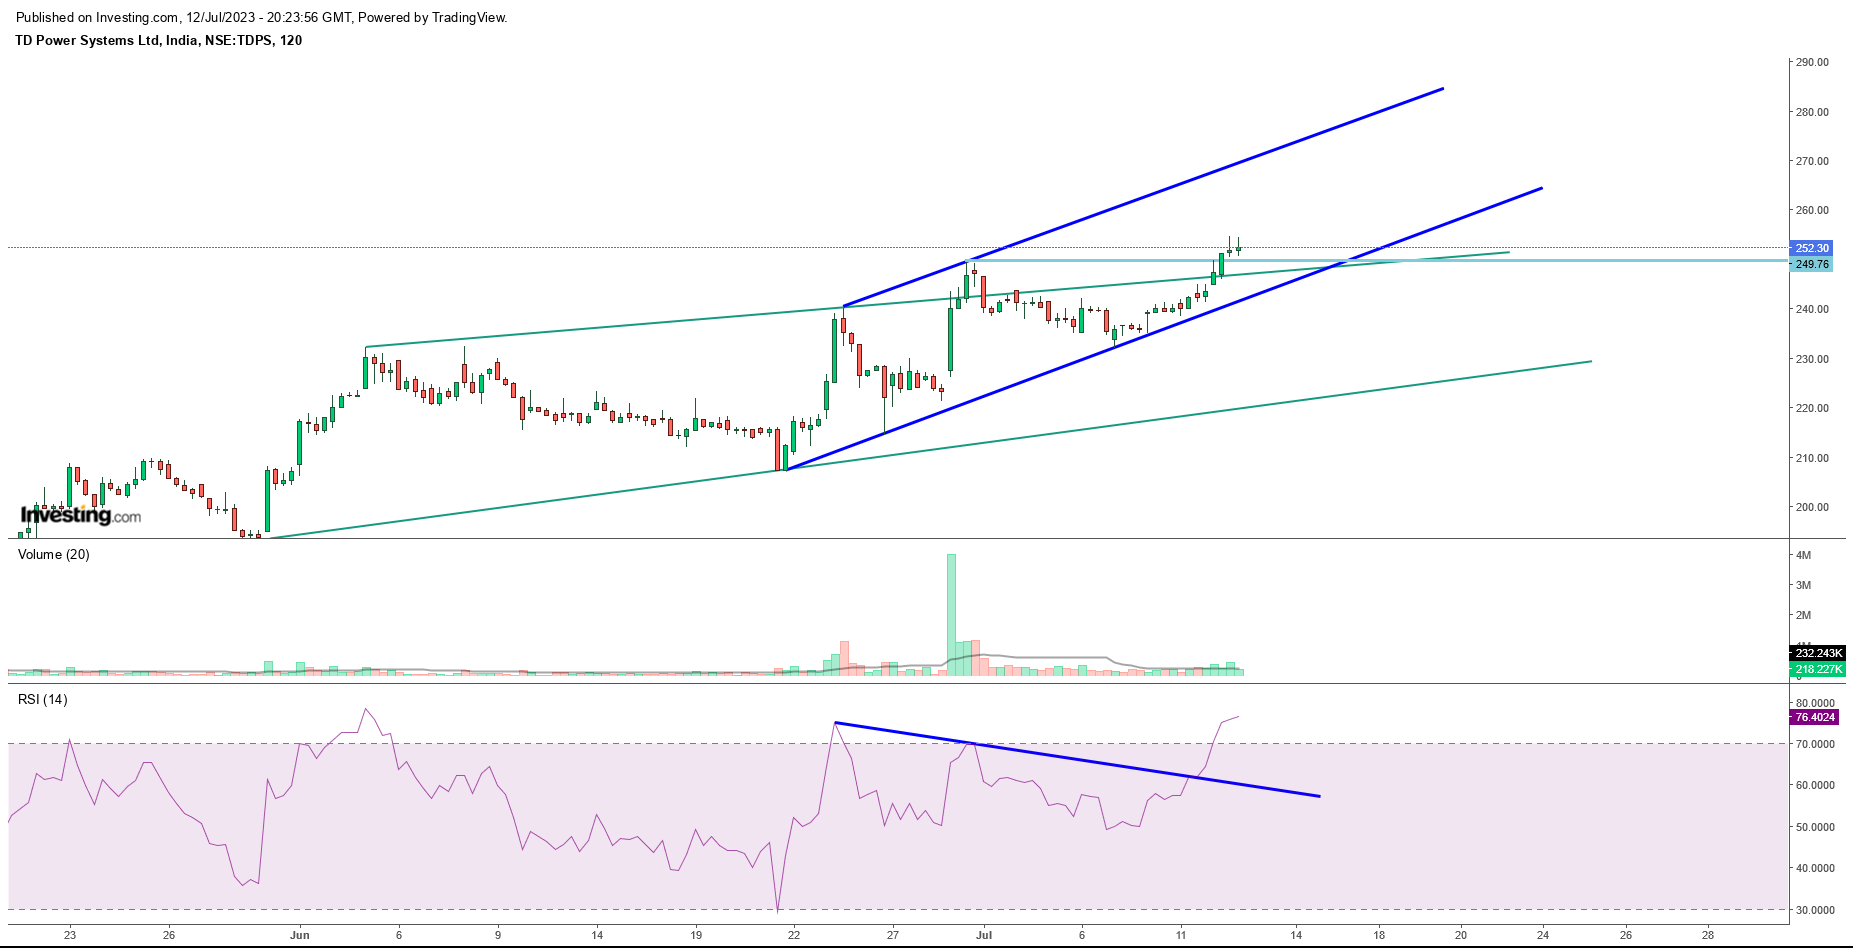
As per above plotted chart, we can see that its has already given rising wedge breakout upside, and now moving in proper rising channel.
as per rsi study it has given “negative bullish divergence” and that confirm after able to break previous top of 250 rs.
overall study indicates that, stock is in strong bullish pattern, and there is scope for price action till it try to touch the upper level of the channel.
stock has given strong breakout above 250 level and further it will try to test upper channel level near to 270 level and if any channel breakout happen above than then this move can extend till 300 rs,
channel bottom near 240 and recent higher bottom of 232 can play as an major support stock.