Nifty daily chart study
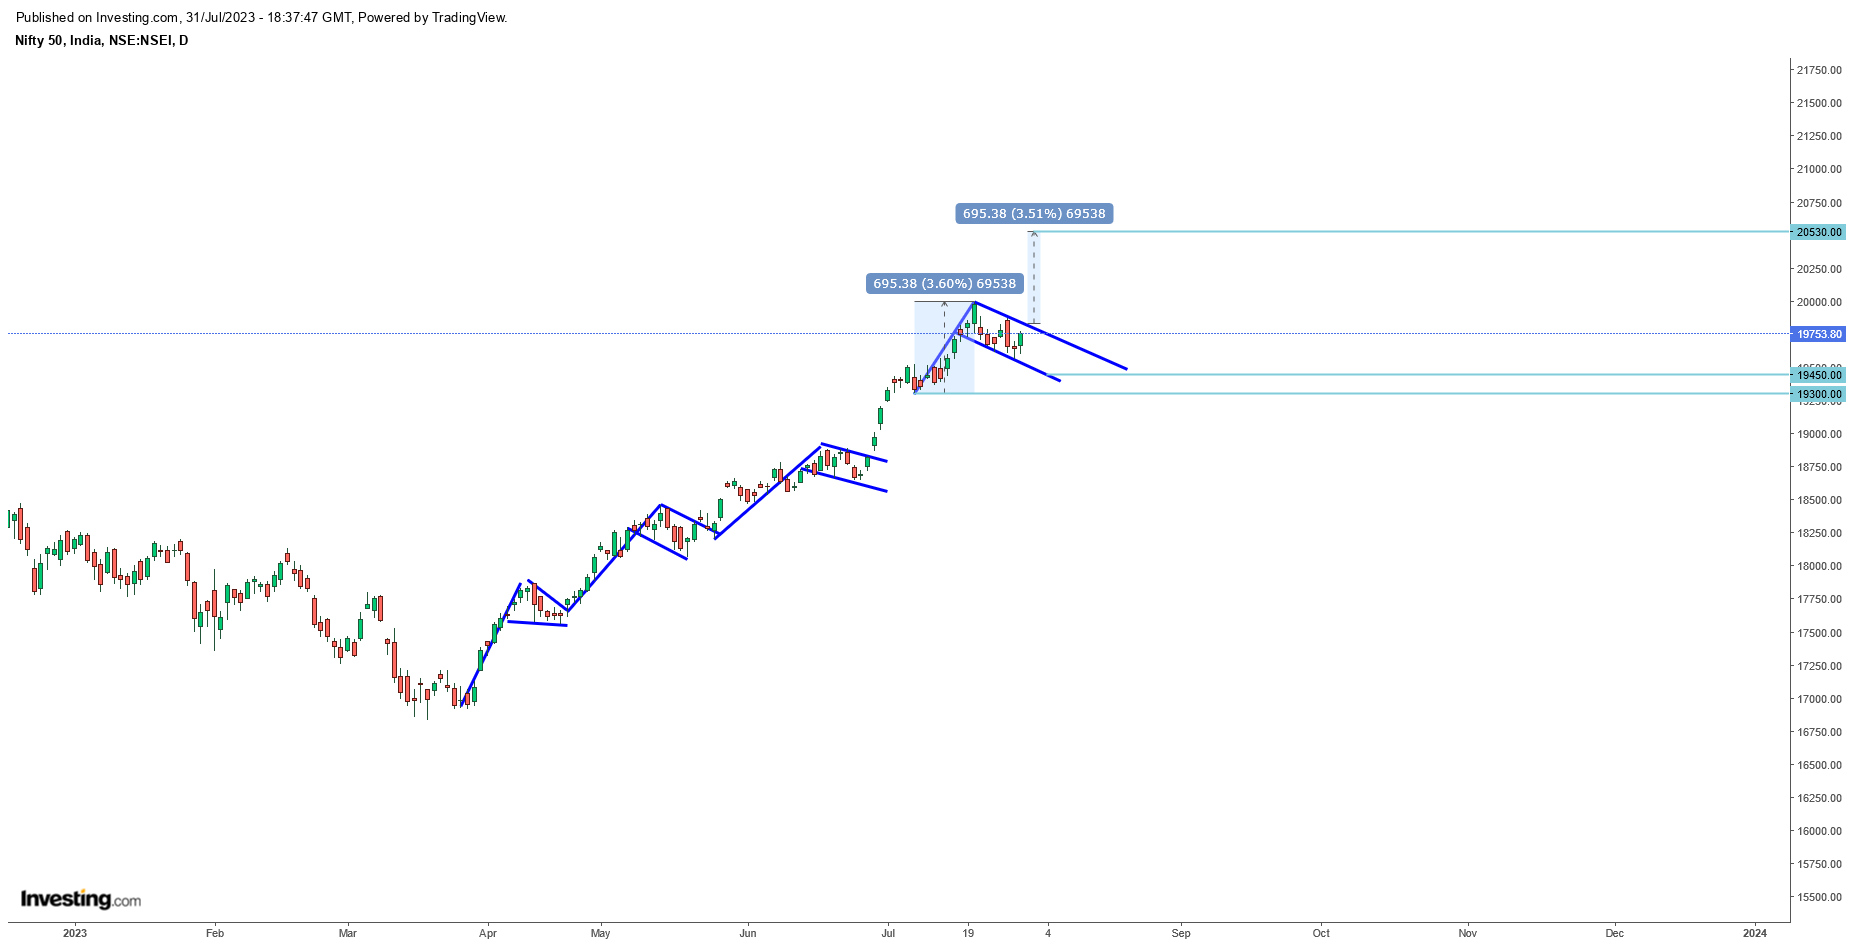
nifty 50, yet simple but seems to be complicated, as per chart we can see that its moving in higher high and higher low formations till now, it means that uptrend is not yet changed and anticipation can kill if you take wrong turn before it happen.
simple chart study shows that nifty 50 is moving with flag and pole formations, and at current stage flag is in making, but yet we are not sure where it will move now.
to get clear idea about its movements pelase follow given levels below.
flag upper breakout 19850
flag support 19450
flag failure or breakdown 19300
as per above level nifty 50 will do breakout again above 19850 level and this can give move till 20530 as per flag and pole pattern formation. flag support is at 19450, but pole bottom or recent higher low can be a strong trend support point and that is 19300 level. if this broken then nifty can change its trend and might go for some strong corrections too.
one need to keep watch on above mention levels and trend to get a clear picture about market directions for current week.