Bank nifty study for 1st week of September
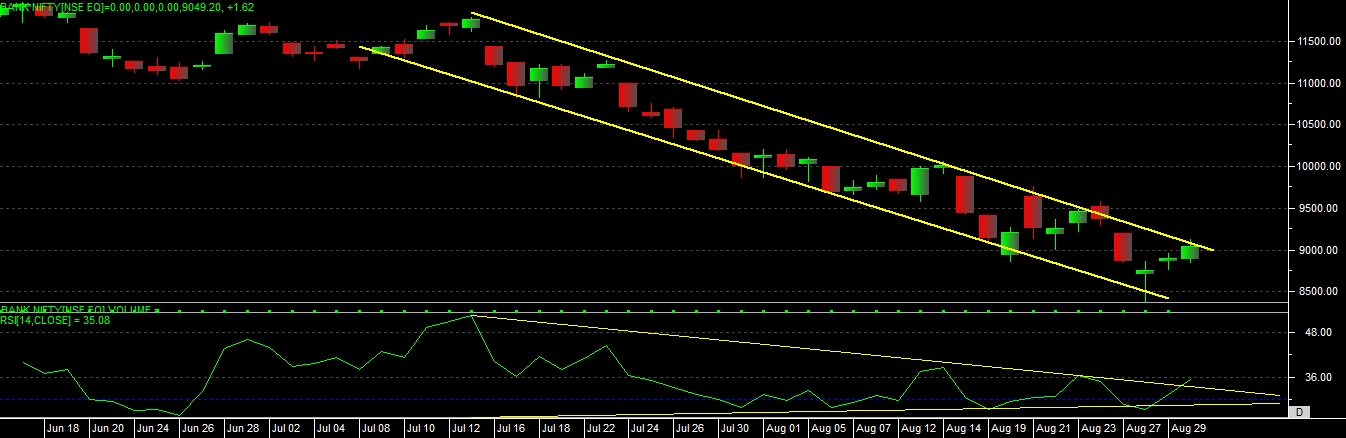
As per the bank nifty chart development we can see that, it’s moving into falling channel of trend line, so till the time it’s not moving above the trend line resistance level we can’t sure about the trend reversal yet.
RSI is sable now and moved out of oversold zone, and it has also touched its resistance level now.
As per candle stick chart pattern, it has made the “MORNING START DOJI” candle stick pattern on 28th August 30, 2013, and even able to trade positive for next two sessions.
RIS also created a “POSITIVE CONVERGENCE” on chart which can also indicate that market can take reverse from here also.
So overall concern and development of bank nifty chart indicate that till the time bank nifty not giving positive above trendline resistance for two days till that time we can’t sure about the uptrend.
For next week support levels are 8750-8500-8300 and upside resistance levels are 9250-9600-9800