Overall last week was highly volatile with full ups and downs, in nifty we inform that support levels till 5100 and also inform that if able to close above 5520 for two days then only reversal possible and exactly same things happen nifty not given close above desire level and from downside also reverse from our support level of 5100.
Weekly study for nifty for 1st week of September
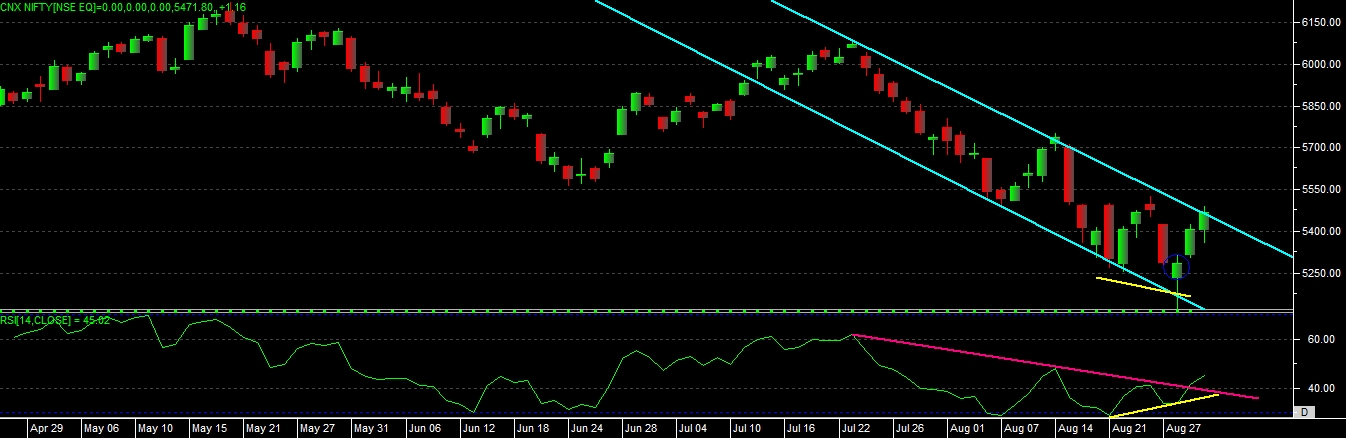
As per the daily chart of nifty we can see that it’s still moving into descending trend line channel, so one thing is very sure and clear, till nifty not moving above this channel we can’t expect any reversal.
One difference and new development on chart is, recent bottom of RSI is out of oversold zone now, and RSI also able to move above its resistance level, but yet price has not confirm the same move so we still need to wait for proper reversal signal.
We can also spot a “POSITIVE CONVERGENCE” signal on chart, but more movement and confirmation is expected after moving of trend line channel only.
On a weekly chart of nifty it has made a “HAMMER” candlestick pattern second in a row, which can also indicate that market still, want to hold with its support, so more weekly bars on chart can define the next trend.
So overall technical study and chart patterns indicate us that, market still not able to confirm its reversal yet and moving in a falling range only, so if it able to move above 5530 level and if able to close above this level for two trading session then only we can confirm the reversal of the trend, if market again fail to confirm this reversal then again fall to see till the downside support levels.
Nifty support levels are 5350-5100-5000 and upside resistance levels are 5550-5650-5750