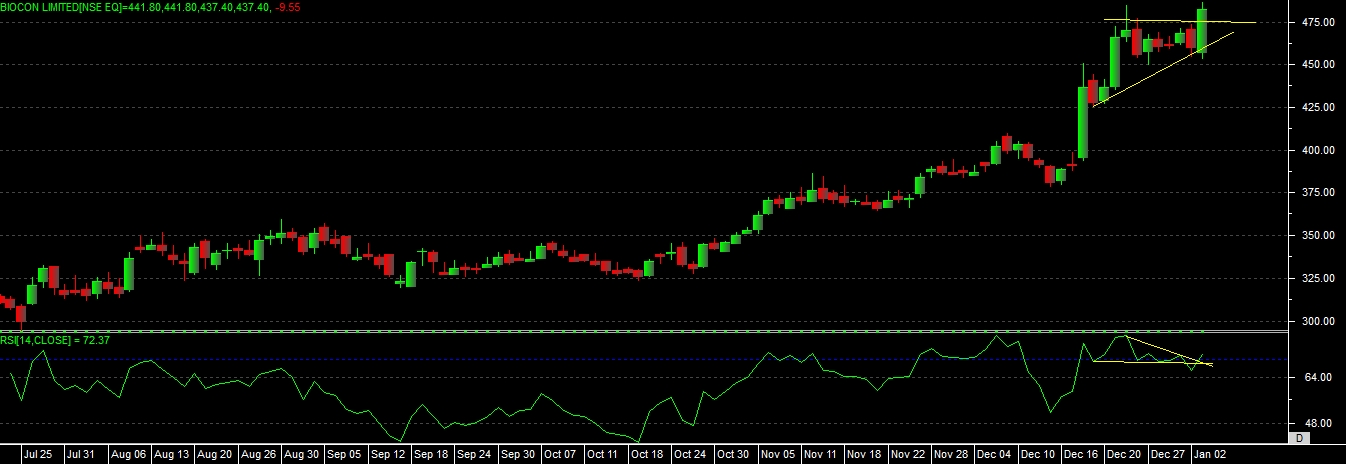
As we can see on chart that stock has already given a big breakout and move in recent past, and now trading on 52 week high level.
now at present we can consider this one for some short term moves in stock.
recently price able to touch the recent high again, and it taking support on chart now.
there is a small development of “ASCENDING TRIANGLE” on chart, where as rsi has developed, falling wedge on chart at present.
there two more developments on charts one is ” POSITIVE DIVERGENCE” and other one is, “BULLISH DIVERGENCE” so this can clearly indicate that, stock is ready for some moves now.
as per the chart, one can buy in this stock above 488 with the sl of 450 target 535-555, if close above 488 level with green bar then only hold long position’s in the stock.