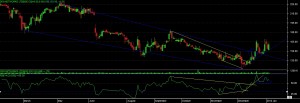
Look at the chart development of DEN NETWORK, last month price able to move above its resistance level.
Also price is traveling above the “FALLING WEDGE” chart pattern now.
there is some good chart development on bottom levels, which i would like to explain, at the bottom stock has given “POSITIVE DIVERGENCE ” signal, and same was confirm buy rsi and price after coming above recent resistance level, pattern shown in chart with yellow lines.
so ultimately stock has given a bottom reversal signal at level of rs. 150 only, so anytime if anyone get the stock at this level then its a good buy with recent bottom as a sl which is at 120 level.
now with the current development, we can see that price is taking support on bottom trend line and rsi able to move below the support line.so this is one more case of divergence at upper levels.
so overall indication is one can enter into stock if it able to give close above 170 level with the stop loss at 140 rs. for the targets of 195-235 levels.
