buy DIVIS LAB in a range of 1400-1420 add more above 1430 sl 1320 target 1550-1650
technical study
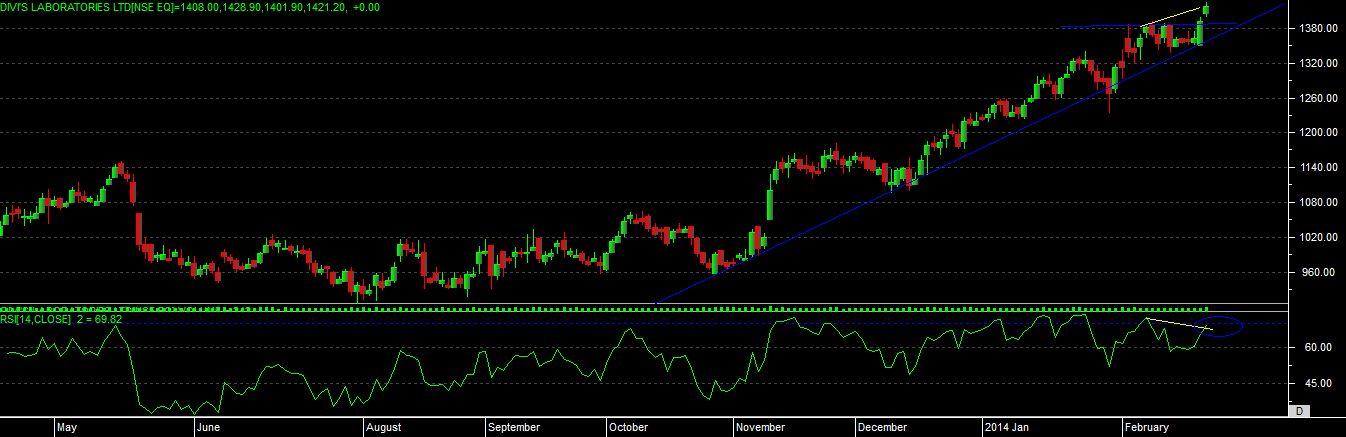
as we can see that stock is taking support on trendline and moving upside.
we can even see a development of “ASCENDING TRIANGLE” at upper levels which has been broken today.
with the RSI it has given a signal of “BULLISH NEGATIVE DIVERGENCE”. and still rsi not able to move in overbought zone as price is trading higher.
as per candlestick patterns it has given a “BULLISH BELT HOLD” pattern on Thursday’s session and next day was followed by normal bullish gap up candle which giving more confidence to bull traders.
so overall basic consideration is, even after showing big move in past 4 months stock still giving bullish signal at upper levels, which can indicate us that there will be good short covering at upper level if price sustain or cross over the previous day’s high.