buy ARVINDLTD above 168 sl 160 target 178-185-197
technical chart study
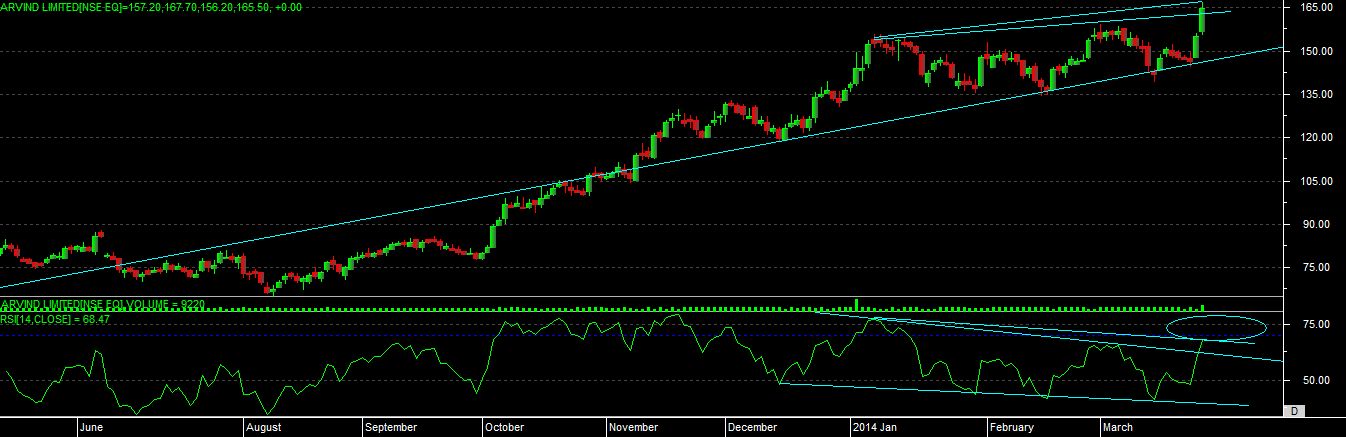
as we can see that stock is in uptrend from past 6 months.
recently it has taken support on trendline with “POSITIVE DIVERGENCE” and able to move till new 52 week high.
today it has given a “BULLISH NEGATIVE DIVERGENCE” breakout at 160 level and able to move till 168 almost, but as per pattern there is another “BULLISH NEGATIVE DIVERGENCE” is in making now.
if we look at the rsi we can clearly see that price moving on top level but yet rsi not able to move into overbought zone, this can indicate us that if price action continues then rsi having more scope to move into overbought zone, which can possible give more momentum in stock price.
so overall indication is if price able to cross the mention level of 168 and able to sustain above this level for atleast 30 min to 1 hour then we can see one more big move in this stock.