buy INGVYSYABANK above 610 sl 550 on closing basis target 685-750-825
holding period 2-3 months
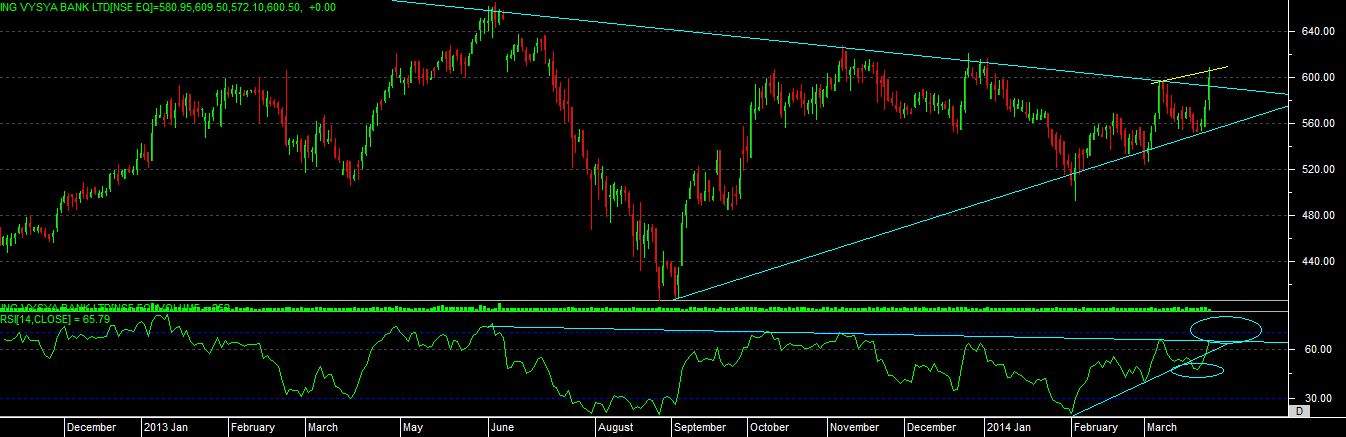
technical chart study
as per technical chart we can see that stock is able to touch its 3 months high now.
there is a development of “SYMMETRIC TRIANGLE” on chart now, having a width of this triangle of rs. 225, so if price able to give close above triangle level for 1-2 session then good up move we can see.
rsi we can see that after coming out from oversold zone, it taken support on every recent deep, and today able to touch the highest resistance level.
rsi still having a scope for movement in overbought zone with the proper price action.
one more positive bar on chart can give signal of “BULLISH NEGATIVE DIVERGENCE” so remember if price close positive above recent high of 610 then only hold it as positional long.
so overall study indicate that stock able to reach its maximum resistance level now, so if we see one more positive session in this stock then only we can see some decent move in coming days.