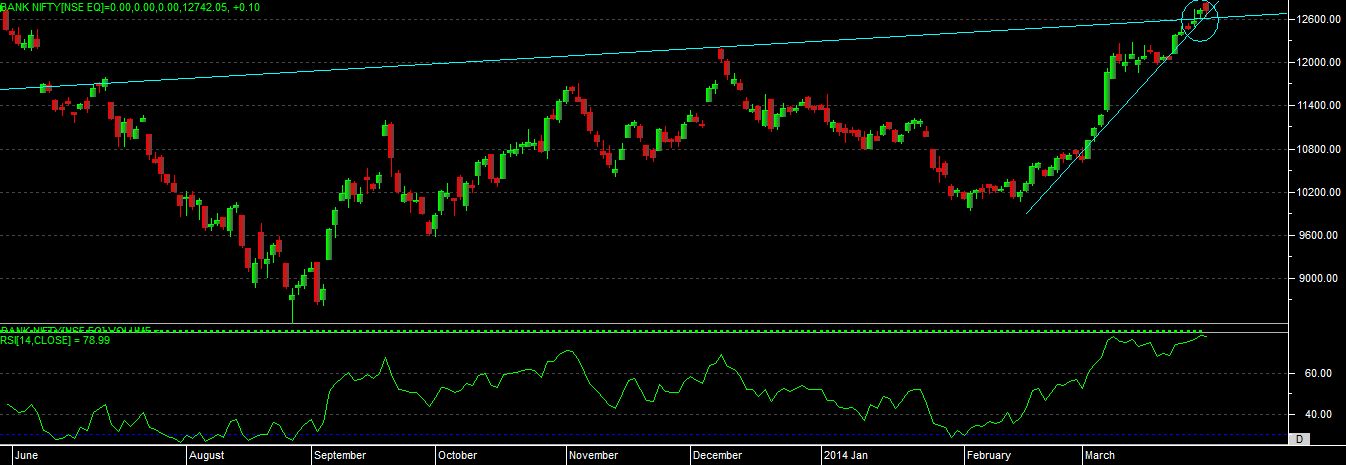
as per the bank nifty chart we can see that at important resistance level, it has given a negative candle on chart, we can spot it as a “DRAK CLOUD COVER” or “HAMMER” candlestick pattern.
but today it has also taken support near to supporting trendline on chart.
at present level rsi is in overbought zone, while nifty given some bearish pattern signal on chart.
so for fresh position development one can go long above 12900 level only if close above this level then to hold your position.
downside having a support at 12500-12600 range, once market able to give close below this range then only to think of positional selling in market.
so as of now range is 12500-12900 till the time market is in this range we can see a consolidation or range bound moves, moving beyond then levels on closing basis can give u a direction move in a market.
so market this levels 12500-12600 and 12900, will play a key role in coming days.