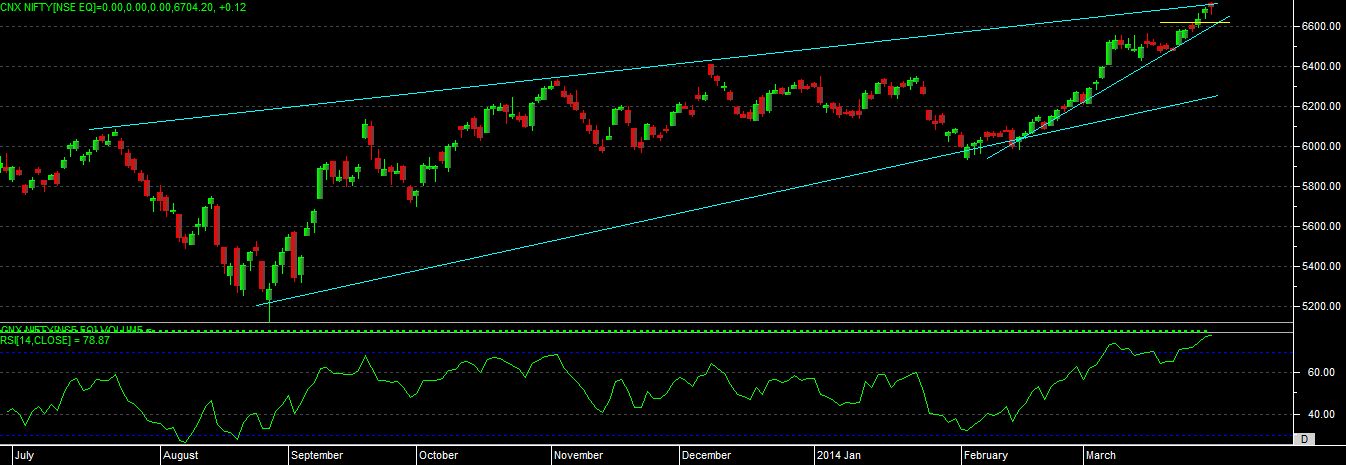
as per the chart, we can see that today nifty has given a red candle on chart, which seems to be a “HAMMER” or even “DOJI” candlestick pattern on chart at important resistance level.
at present rsi is also in overbought zone now, and price action taken some pause, at higher level.
so overall view is one can enter into longside, only if nifty able to move above 6735 and close above this level, then only we can see more up moves.
down side we see that it has recently take a support on trendline and given a good bounce, so at this point if market not able to break the upper level and able to close below 6640 for two trading sessions then we can see good fall in a market.
in broader way pattern can also suggest that its a “RISING WEDGE” and upper side this is 4th top at resistance trendline.
so overall view is we have got the range on chart now 6735-6640 till the time market is in this range dont go for positional on index once we see close beyond the levels we can expect for the good direction move, which can be upside or downside also depending on levels.