buy ABBOTT above 1800 {on closing basis} sl 1600 target 2200-2700-3500
delivery holding for 3-9 months range.
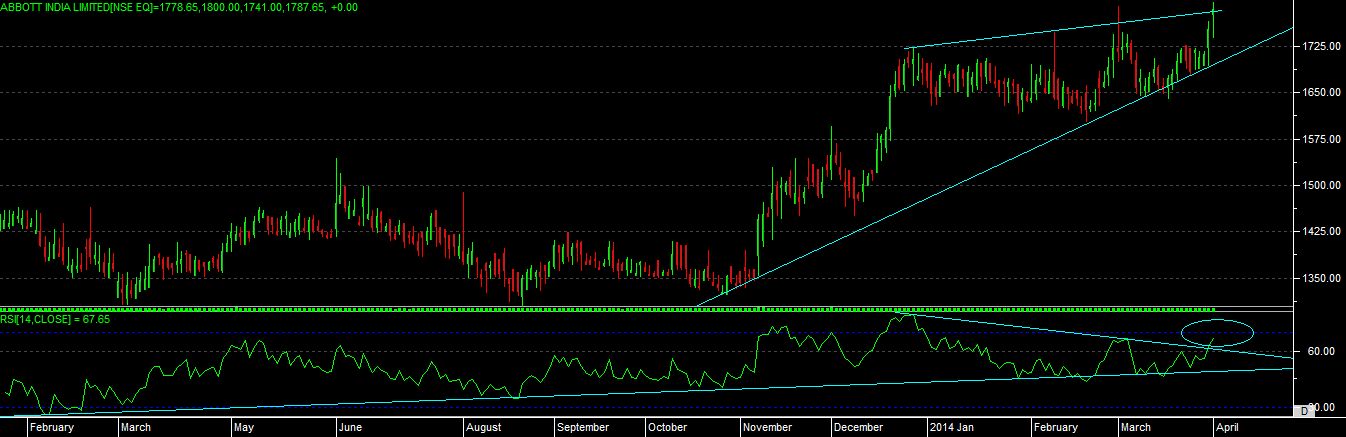
technical chart study
as per the chart we can see that stock is moving towards higher levels now, even taken a good support on trendline and continuing its upward move.
as per rsi we can see that it has given a “BULLISH NEGATIVE DIVERGENCE” signal on chart as price and rsi both able to move above the resistance level, so one more move above given level with close above mention level can give us a confirmation of delivery holding.