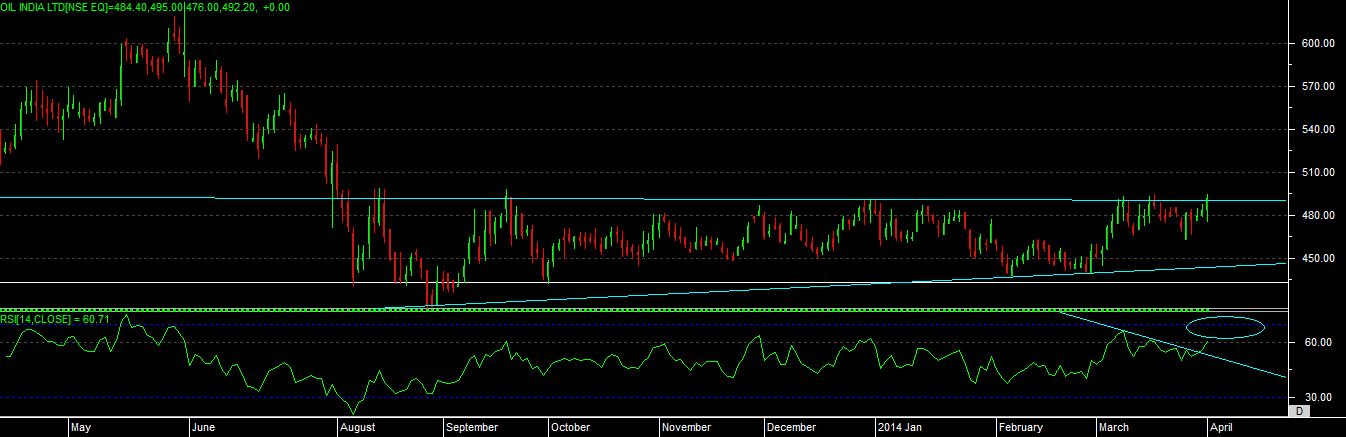
buy OIL INDIA above 495 some resistance at 500 above 500 add more sl 484 target 515-545
technical chart study
as we can see that stock has face resistance in a range of 495-500 for almost 5-6 times in last 9 months, and now its again near to resistance level.
we can see a good consolidation on chart now, as rsi yet not moved in overbought region from past 9 months.
with the rsi its giving a signal of “BULLISH NEGATIVE DIVERGENCE” now.
so one thing to remember if you look to carry position in this stock then wait till it close above 500 level one can buy above 495 and if sustain and cross 500 then also buy with mention sl, but if price not able to sustain above mention levels for 15-30 min then hold small and limited qty only, as we can see that stock has reverse many times from same level, so sustaining is a big point.