buy LT above 1400 closing basis, sl 1200 target 1600-1800-2200
6-9 month short term it can come till 1450
technical chart study
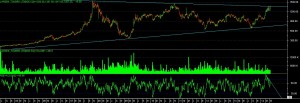
as per chart development we can see that recently it touch long term resistance level on chart. which is near to 1400 level.
even its a bigger development of “SYMMETRIC TRIANGLE” on chart now.
in past two month it made “INVERTED RISING WEDGE” or we can say “EXPANDING TRIANGLE” on chart.
even rsi suggesting “BULLISH NEGATIVE DIVERGENCE” signal now.
as per candlestick pattern it has given “STRONG BULLISH” runaway candles in last two session, which can give us a indication of aggressive buying at this points.
so over all study indicating that recently stock able to move above its 4 years high level i.e near about 1200 so now this can be good support on long term chart if price able to move above long term resistance.
