buy OIL INDIA above 515 close, sl 470 target 545-575
technical chart study
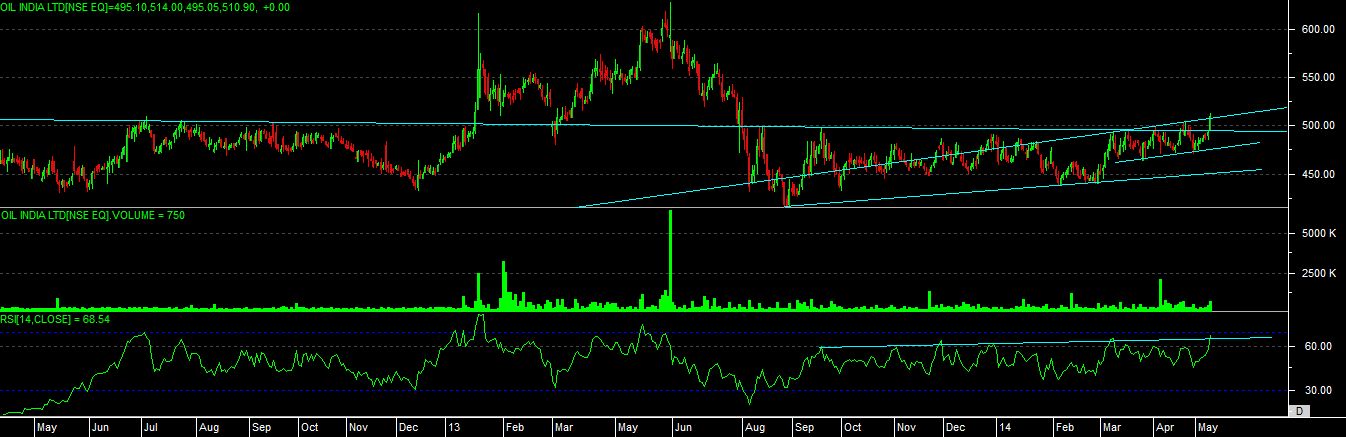
as per technical chart of stock we can see that stock was underperforming in past 1 year time, and now it able to move above its 10 months high level.
we can even see that it has made “ASCENDING TRIANGLE” on chart now, and recently it developed rising channel on chart.
stock broken 10 month high but rsi yet not moved into oversold zone, so it can show us that there is still scope for more up move if price able to break the mention levels.
so one can buy this stock with mention level entry and stop loss and if price able to give good close then need to hold.